Six-Month Winning Streaks for Oil
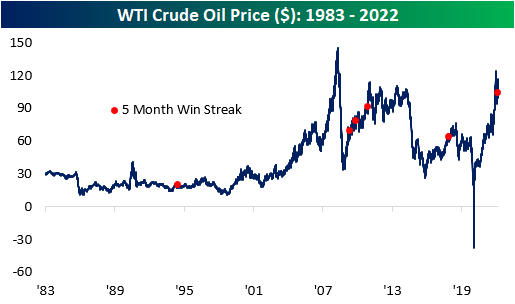
Coming out of Memorial Day weekend, WTI crude oil closed out May with its sixth straight monthly gain, resulting in the second-longest streak going back to 1983. Everyone with a car has dealt with rising costs at the pump, and the AAA national average price per gallon is currently $4.67, the highest level on record. This comes as the Biden administration has halted the importation of Russian oil, and the European Union attempts to reduce its energy dependence on Russia as well. At the same time, the reopening has caused a pick-up in demand, and the gross imbalance of supply and demand has pushed up prices to nearly unprecedented levels.

Since the US government stopped price controls on US crude oil in the early 1980s, there have only been six other periods where WTI prices rose for five or more consecutive months. As you can see from the chart below, half of these occurrences were shortly after the Global Financial Crisis, as prices rebounded from the sharp downturn in prices during the financial collapse, and the most recent was in early 2018.
Following five consecutive months of gains in oil, the average performance has been relatively weak compared to historical averages. In the first five months of each streak, oil prices have rallied by an average of 40.9% (median: 38.6%), which is nearly ten times higher than the average of all five-month periods since 1983. However, oil tends to underperform in the near term following these occurrences, registering an average loss of 3.2% and 0.8% over the next week and month, respectively. Notably, this was the only occurrence in which the price of oil climbed higher in both the following week and month, gaining 4.9% and 9.5% respectively. The only period in which the average performance was higher than that of all periods is three months, as oil has averaged a gain of 4.4% after a streak of five months is reached.

The chart below summarizes the performance one year before and after a streak of five months is reached. As you can see, oil has traded most similarly to the late 2009 occurrence, in which the price of oil rose by 15.1% in the following year. Long story short, although the average performance in these time periods is relatively weak, there isn’t a clear trend in performance in one direction or the other. Click here to become a Bespoke premium member today!

Biggest Energy Names See Record Moves
The Energy sector has been on an absolute tear over the pandemic period with a 273% gain since the pandemic lows in March 2020. During the overall market downturn of the past several months, it is the only cyclical sector to have managed to retain its uptrend as it has rallied over 60% year to date compared to a 13% decline for the S&P 500. Taking a look through our Chart Scanner tool, there is not too much variation in the charts of large-cap Energy stocks with strong uptrends across the board and many new multi-year highs as a result. Taking a look at two of the largest members who account for nearly three-quarters of a trillion dollars in market cap, Exxon Mobil (XOM) and Chevron (CVX) are good examples. CVX has reached new all-time highs following its meteoric rise over the past couple of years while XOM has recovered most of the past decade’s declines. Additionally, we would note that XOM has historically tended to be much larger than CVX, but the pandemic and the subsequent rally over the past couple of years have brought the two stocks’ market caps much more closely in line with one another.
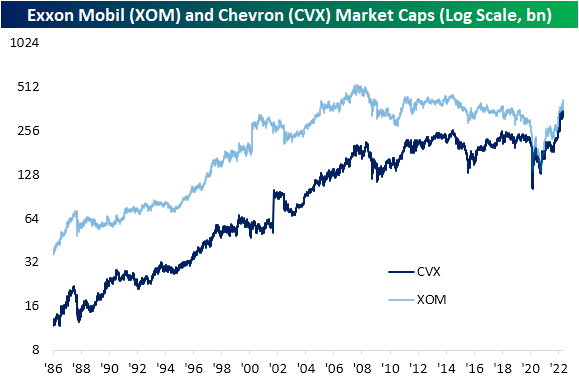
Both long-standing staples of the Energy sector, XOM and CVX are also notable in that they are both dividend aristocrats (a group of stocks that have now raised their dividend annually for 25 or more consecutive years). That means on top of massive capital gains, investors have also been rewarded handsomely with dividends. Even after these massive rallies, CVX still yields 3.25% and XOM pays an even better 3.67%. Taking this into account, the two-year runs including dividends that these stocks have been on are unlike anything observed since at least the early 1980s. Given the record two-year run we’ve seen in the Energy space, it’s tough to get super bullish on this area of the market now. Remember, we saw an explosive move higher like this for other areas of the market earlier on in the post-pandemic era (think meme stocks, SPACs, high growth, etc.), but once the tide turned in late 2021, the downside reversal was just as extreme. Energy stocks have completely different fundamental risk profiles than aggressively valued Tech stocks, and ultimately their performance is mostly tied to the price of oil. That being said, investor psychology and herd mentality work the same regardless of the asset class. Click here to learn more about Bespoke’s premium stock market research service.

Bespoke’s Morning Lineup – 6/1/22 – QT Begins
See what’s driving market performance around the world in today’s Morning Lineup. Bespoke’s Morning Lineup is the best way to start your trading day. Read it now by starting a two-week trial to Bespoke Premium. CLICK HERE to learn more and start your trial.
“Often we look so long at the closed door that we do not see the one which has been opened for us.” – Helen Keller

Below is a snippet of content from today’s Morning Lineup for Bespoke Premium members. Start a two-week trial to Bespoke Premium now to access the full report.
It’s a new month and markets are looking to start off on a good note with equity futures modestly higher across the board. Positive sentiment this morning has been driven by earnings from Salesforce (CRM) and Victoria’s Secret (VSCO). In economic data, German Retail Sales came in weaker than expected for the month of April, and PMI data for the month of May in both Asia and Europe generally showed a slowing but still growing trend.
Looking ahead here in the US, Construction Spending (April), ISM Manufacturing (May), and JOLTS (April) will all be released at 10 AM.
In today’s Morning Lineup, we discuss recent trends in the natural gas market (pg 4), activity in Asian and European markets (pg 4), May PMI trends from around the world (pg 5), and then selected economic data from Asia and Europe (pg 6).
We’ve noted the wide divergence in performance between individual sectors this year, but within the commodity space, the discrepancies are even wider. As shown in the snapshot of our Trend Analyzer below, the spread in YTD performance among commodity-related ETFs through the end of May is over 130 percentage points! At the top of the list, the US Natural Gas Fund (UNG) has rallied more than 123% even after falling more than 7% over the last five trading days. Behind UNG, the next best performing ETFs are also energy-related but they’re up less than half as much as UNG. At the other end of the spectrum, precious metals have been the worst performers YTD as Silver (SLV) is down nearly 8%, while gold-related ETFs are barely hanging on to gains. That may not sound like much, but compared to equities, which are down by double-digit percentages this year, flat is 2022’s version of up.

Start a two-week trial to Bespoke Premium to read today’s full Morning Lineup.
Bespoke’s Morning Lineup – 5/31/22 – Back to the Grind
See what’s driving market performance around the world in today’s Morning Lineup. Bespoke’s Morning Lineup is the best way to start your trading day. Read it now by starting a two-week trial to Bespoke Premium. CLICK HERE to learn more and start your trial.
“We can draw lessons from the past, but we cannot live in it.” – Lyndon Johnson
Below is a snippet of content from today’s Morning Lineup for Bespoke Premium members. Start a two-week trial to Bespoke Premium now to access the full report.
After major US equity indices broke what were the longest weekly losing streaks in decades, it’s back to reality again this week as futures are lower across the board. Yesterday’s announcement that Europe would ban imports of most Russian oil has crude trading up over 3% this morning leading to further concerns of potential inflationary pressures. China reported PMI figures for May overnight, and while both the Manufacturing and Services sectors remain in contraction, the magnitude of the weakness wasn’t as bad as expected.
It’s a busy day of economic data this morning as we’ll get Case Shiller Home Price Data at 9 AM along with the Chicago PMI at 9:45 and then Consumer Confidence at 10 AM (all times eastern).
In today’s Morning Lineup, we recap key events in the Russia-Ukraine war (pg 4), activity in Asian and European markets (pg 4), and key economic data from Europe (pg 5).
As mentioned above, the EU embargo of Russian oil raises concerns of further inflationary pressures, which at the moment aren’t showing any signs of getting under control. Just this morning, headline inflation in the region rose more than expected rising to a record high of 8.1% y/y. That’s up from a y/y reading of negative 0.3% just 17 months ago. It’s only a 20-year history, but the fact that headline inflation in Europe has gone from close to record lows and then easily to record highs is pretty extreme.

Start a two-week trial to Bespoke Premium to read today’s full Morning Lineup.
Bespoke Brunch Reads: 5/29/22
Welcome to Bespoke Brunch Reads — a linkfest of the favorite things we read over the past week. The links are mostly market related, but there are some other interesting subjects covered as well. We hope you enjoy the food for thought as a supplement to the research we provide you during the week.
While you’re here, join Bespoke Premium with a 30-day free trial!
Sentiment Check
Stock Selloff to Intensify as Fresh 10% Plunge Looms, Survey Finds by Benjamin Purvis (Yahoo!/Bloomberg)
A survey of Bloomberg Terminal users reckon the US equity market bottom is around 10% lower near 3500, a brutal 27% decline from last year’s peak. At the very least, that’s a serious insight into the sentiment of institutional investors here. [Link; auto-playing video]
The Market Is Melting Down and People Are Feeling It. ‘My Stomach Is Churning All Day.’ by Justin Baer (WSJ)
Stock market bulls have started to panic with a bear market for the S&P 500 in sight, as concerns over everything from retirement security to availability of down payments and other spending gets dragged down by the market’s plunge. [Link; paywall]
Scarcity
The Trouble With Lithium by Annie Lee (Bloomberg)
Lithium has once again reared its head as a critical bottleneck and cost pressure for everything from energy storage to electric vehicles, with recent price increases working out to more than $1,000 per vehicle of additional costs. [Link; soft paywall]
Global food crisis looms as fertilizer supplies dwindle by Joel K. Bourne, Jr. (National Geographic)
War, sanctions, weather, and export restrictions have fueled an evaporation of global fertilizer supply that is adding new cost pressures to agricultural commodities amidst a global food shortage. [Link]
The Average Age of Vehicles on U.S. Roadways Hits a Record 12.2 Years by Nora Eckert (WSJ)
With car sales beaten down by semiconductors shortages and ever-longer lifetimes for modern vehicles, the average age of US cars continues to grind higher. [Link; paywall]
Real Estate
Paradise Burned to the Ground. Now It’s Another Hot Housing Market by Aaron Gordon (Vice)
After a California town burned to the ground in 2018, residents feared they would never be able to rebuild. But the COVID housing market has flipped the script and new residents are piling in to buy up every property in sight, regardless of the fire risk. [Link]
All My Apes Gone
They spent a fortune on pictures of apes and cats. Do they regret it? by Pranshu Verma (WaPo)
The NFT market has taken a serious leg lower, with a big decline in both prices and volumes amidst a re-think of one of the most over-the-top speculative markets on record. [Link; soft paywall]
Someone Stole Seth Green’s Bored Ape, Which Was Supposed To Star In His New Show by Sarah Emerson (BuzzFeed)
An NFT was set to star in a new show produced by actor Seth Green, but the Bored Ape token was stolen recently and with it the commercial rights required to produce the show. [Link]
Portfolios
Investors Dare to Dip Back Into Bonds by Matt Wirz (WSJ)
With stocks pounded this year, investors are desperate for stability and are seeking it in good old fashioned bonds despite soaring yields year-to-date. [Link; paywall]
The Stock Market’s Drop Is Hitting Many 401(k)s Harder This Time by Anne Tergesen (WSJ)
While target date funds are designed to reduce exposure to equity markets as they approach a hypothetical retirement date, they retain large exposures to stocks…something that investors may not have been aware of or prepared for during the recent stock drop. [Link; paywall]
Demographics
Fragile Job Gains for Black Workers at Stake in Inflation Fight by Matthew Boesler, Jonnelle Marte, and Catarina Saraiva (Bloomberg)
The share of the Black population between 25 and 54 years old who are currently employed hit a 22 year high in April, with the gap in that measure between Black and white Americans at the lowest levels on record. But the FOMC’s focus on inflation may derail all that progress. [Link; soft paywall]
U.S. Births Increase for First Time Since 2014 by Janet Adamy and Anthony DeBarros (WSJ)
After a collapse during the first year of the pandemic, US births rose for the first time since 2014. In the background, births among teenagers (15-19) hit the lowest levels on record and have almost fallen below the 40-44 bracket. [Link; paywall]
Space
Here’s How NASA Plans to Keep the Power on for a Future Moon Base by Kelsey D. Atherton (The Daily Beast)
Long-term lunar habitation is going to require power, and NASA is designing a trio of micro-grids that will sustain the habitat, power mining operations, and support materials processing; there’s also a detailed discussion of lunar sovereignty concerns in this story among other tidbits. [Link]
End of An Era
New York City Removes Last Public Pay Phone in End of an Era by Ginger Adam Otis (WSJ)
The last of NYC’s public street payphones was removed from 7th between 49th and 50th this week, headed to the Museum of the City of New York. [Link; paywall]
Read Bespoke’s most actionable market research by joining Bespoke Premium today! Get started here.
Have a great weekend!
It’s Over
Spring is meant to be a season of growth, but that’s the last way to describe what’s been going on in financial markets for the last several weeks. The S&P 500 came into April with a three-week winning streak on Friday, April 1st, but in what has been one of the cruelest April Fools pranks we’ve ever seen, the S&P 500 was down for seven straight weeks in what was the longest weekly losing streak since March 2001. For the DJIA, the streak was even more extreme with eight straight weekly declines for the longest run of consecutive declines in 99 years. 99 years is a long time.
As shown in the chart below, the streak that ended this week was one of just three other periods where the S&P 500 was down for seven or more straight weeks. The other three were in May 1970 (8 weeks), March 1980 (7 weeks), and March 2001 (8 weeks). Besides relentless selling over several weeks, the other factor these three periods have in common is that they all occurred during recessions. May 1970 was right in the middle of a recession, March 1980 was two months into the first of the ‘double-dip’ recessions in the early 1980s, and March 2001 came just as the economy was starting to roll over from the dot-bomb fueled contraction. Economists have assured anyone who will listen that the economy isn’t close to a recession yet, but then again, in Q1 the economy contracted by 1.5%, and the latest projection from the Atlanta Fed’s GDPNow model currently has a forecast of just 1.9% growth for Q2.

As an investor, whether we’re in a recession or not at this point is almost irrelevant. Equities have already fallen sharply. The more important question is where the economy is going. Anyone who has that kind of crystal ball has a distinct advantage. Think about it. When a recession begins, no one watching just the economy ever knows what is about to unfold. They may be thought of as periods of economic weakness and high unemployment, but the start of a recession also coincides with the point at which the economy is at its strongest and firing on all cylinders. The last thing on anyone’s mind at that point is a recession.
In terms of the prior streaks where the S&P 500 declined for seven or more weeks in a row, forward performance was mixed but generally positive. Three is admittedly a small sample size, but one, three, six, and twelve months later, the S&P 500 was higher at least two out of three times, and three months later (13 weeks) it was higher all three times. 2022 has been a lousy year so far. Wouldn’t it be nice, though, if six months from now at Thanksgiving, instead of everyone worrying about a new emerging strain of COVID (like we did last year), we were all thankful that stocks and bonds stabilized and maybe, just maybe, even partly dug themselves out of the hole they’ve already put themselves into? Click here to learn more about Bespoke’s premium stock market research service.

Bespoke’s Morning Lineup – 5/27/22 – Up. Finally?
See what’s driving market performance around the world in today’s Morning Lineup. Bespoke’s Morning Lineup is the best way to start your trading day. Read it now by starting a two-week trial to Bespoke Premium. CLICK HERE to learn more and start your trial.
“You take an educated gamble. If you don’t occasionally make a mistake, you’re not doing your job.” – James Sinegal
Below is a snippet of content from today’s Morning Lineup for Bespoke Premium members. Start a two-week trial to Bespoke Premium now to access the full report.
Is this the week markets finally manage to scratch out a rally? Barring an absolute collapse into the three day weekend, US stocks are poised to finish off the week significantly higher, but before we get to the closing bell, there’s a bunch of economic data to get through, including Wholesale Inventories, Personal Income and Spending, the PCE Core Deflator, and Michigan Confidence.
Treasuries are modestly higher, equities are flat, crude oil is slightly lower, and bitcoin is down heading into the final session before a three-day weekend.
In today’s Morning Lineup, we recap major market moves out of Asia and Europe as well as the comparison in the performance between US and European stocks so far this year.
Memorial Day weekend marks the unofficial start to the summer driving season, and prices heading into the period have surged both this month and on a YTD basis. The national average price of a gallon of gas, according to AAA, sits at $4.60 per gallon, which is up just under 10% this month (third-largest increase since 2005) and 40% YTD (second largest YTD increase since 2005). The 40% YTD increase is more than twice the historical average and follows what was a 35% YTD increase last year. There’s pain at the pump.

Gas prices have no doubt surged, but if there’s any potential silver lining, it is that from a seasonal perspective, we’re at the point in the year where prices tend to peak. Whether prices follow that seasonal pattern this year, though, remains to be seen.

Start a two-week trial to Bespoke Premium to read today’s full Morning Lineup.
Bulls Back Below 20%
In spite of the S&P 500 actually reversing course and heading higher in the past week, sentiment on the part of individual investors surveyed by the American Association of Individual Investors has turned lower, once again falling below 20%. That is the first sub-20% reading since the last week of April, although the multiple readings in the mid-teens last month were lower than this week’s reading.
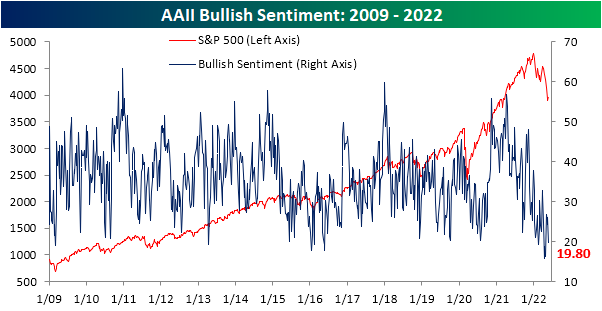
The past several months as the major indices have entered downtrends have seen an impressive collapse in optimism. Over the past six months, slightly more than half of the time less than a quarter of AAII respondents have reported as bullish. Going back through the history of the survey beginning in the late 1980s, there have only been two other periods with this same sort of consistently pessimistic attitude for an extended period of time: late 1988 to early 1989 and two years later in early 1991.

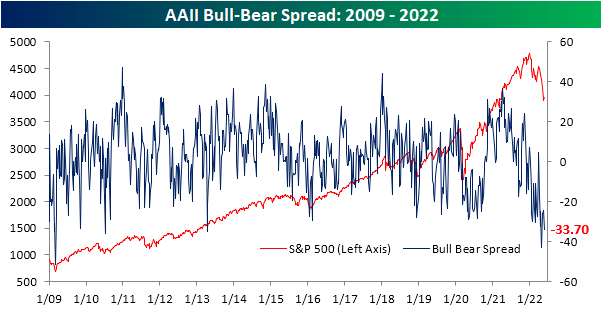
Given bulls were hard to find, bearish sentiment ticked up to 53.5%. Although over half of respondents are expecting lower stock prices, that is still not as high of a reading as the end of April when it was nearly 60%.

Regardless, bears continue to heavily outweigh bulls as the bull-bear spread has now sat in negative territory for all but two weeks over the past half-year.
The bearish camp did not pick up all of the losses in bullish sentiment. Neutral sentiment rose back up to 26.7% this week marking the highest reading in a month. That being said, the reading remains below the historical average of 31.43%. Click here to learn more about Bespoke’s premium stock market research service.

The Bespoke 50 Growth Stocks — 5/26/22
The “Bespoke 50” is a basket of noteworthy growth stocks in the Russell 3,000. To make the list, a stock must have strong earnings growth prospects along with an attractive price chart based on Bespoke’s analysis. The Bespoke 50 is updated weekly on Thursday unless otherwise noted. There were no changes to the list this week.
The Bespoke 50 is available with a Bespoke Premium subscription or a Bespoke Institutional subscription. You can learn more about our subscription offerings at our Membership Options page, or simply start a two-week trial at our sign-up page.

The Bespoke 50 performance chart shown does not represent actual investment results. The Bespoke 50 is updated weekly on Thursday. Performance is based on equally weighting each of the 50 stocks (2% each) and is calculated using each stock’s opening price as of Friday morning each week. Entry prices and exit prices used for stocks that are added or removed from the Bespoke 50 are based on Friday’s opening price. Any potential commissions, brokerage fees, or dividends are not included in the Bespoke 50 performance calculation, but the performance shown is net of a hypothetical annual advisory fee of 0.85%. Performance tracking for the Bespoke 50 and the Russell 3,000 total return index begins on March 5th, 2012 when the Bespoke 50 was first published. Past performance is not a guarantee of future results. The Bespoke 50 is meant to be an idea generator for investors and not a recommendation to buy or sell any specific securities. It is not personalized advice because it in no way takes into account an investor’s individual needs. As always, investors should conduct their own research when buying or selling individual securities. Click here to read our full disclosure on hypothetical performance tracking. Bespoke representatives or wealth management clients may have positions in securities discussed or mentioned in its published content.
Bespoke’s Morning Lineup – 5/26/22 – Is it Real? Or is it Metaverse?
See what’s driving market performance around the world in today’s Morning Lineup. Bespoke’s Morning Lineup is the best way to start your trading day. Read it now by starting a two-week trial to Bespoke Premium. CLICK HERE to learn more and start your trial.
“Someday neither AI nor us will be able to tell whether we are in a virtual or physical world.” – Jensen Huang
Below is a snippet of content from today’s Morning Lineup for Bespoke Premium members. Start a two-week trial to Bespoke Premium now to access the full report.
We’ll be honest, based on the way markets have been trading the last couple of months, we would have expected that if the 7th largest stock (NVIDIA) in the Nasdaq 100 was trading 5% lower in reaction to earnings, that futures for the index would also be lower. Right now, futures are actually trading about 0.4% higher. Is this real?
In addition to the positive tone in futures, there’s also some major M&A news with Broadcom (AVGO) reaching a deal to acquire VMware (VMW) in a cash and stock deal valued at $61 billion in what would be one of the largest tech mergers of all time. On the one hand, a bull would point to this transaction as a sign that companies are finding value in the market after the plunge over the last five months. On the other hand, as recently as February, VMW’s stock was right around the $142.50 price the company agreed to sell itself at today, so does that indicate that management expects limited upside for the industry going forward?
It’s a big morning for economic data with revised GDP for Q1 (revised lower), Personal Consumption (higher than expected), PCE (lower than expected), and Jobless Claims (initial lower than expected, continuing higher) all just released at 8:30. Later on this morning, Pending Home Sales and the KC Fed manufacturing report will be released at 10 AM.
In today’s Morning Lineup, we recap morning earnings reports (pg 4), overnight central bank actions (pg 4), the latest economic data out of Asia and Europe (pg 5), and a lot more.
The Energy sector hit another new 52-week high yesterday further cementing its lead as the top-performing sector in the S&P 500. Given the rally over the last year, it’s pretty hard to believe that the Energy sector is still more than 10% below its record high back in 2014.

Given the rally in Energy, the sector’s relative strength has made a significant turnaround this year. After eight years of near-constant underperformance, the recent outperformance has taken its relative strength to levels not seen in three years.

Start a two-week trial to Bespoke Premium to read today’s full Morning Lineup.