Gasoline National Average Above $4
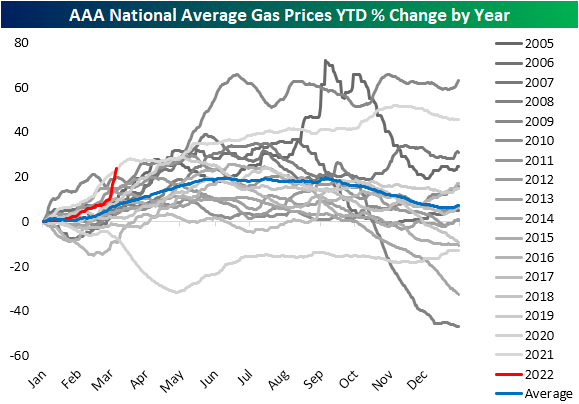
We have consistently been covering the surges in commodity prices over the past couple of weeks, and over the weekend there was yet another major development on this front. As shown below, for the first time since June/July 2008, the national average for a gallon of regular gasoline crossed above $4. As the post-pandemic period has progressed, gas prices have been rapidly on the rise but the move since the late December low of $2.83 has been outright parabolic.

With regards to seasonality, this point of the year tends to see gas prices rise up through the late spring where they then plateau through the summer and fall until year-end. Whereas prices had been following the usual seasonal pattern, albeit growing at a slightly above-average rate, the recent surge has brought the year-to-date gain up to 23% which puts it back on the pace with the historically large year-to-date gains last year.
AAA also provides a breakdown of prices by state. While the national average sits at $4.065, there are 22 states with an average price also above $4 compared to only two states (California and Hawaii) one month ago. Today, those two still have the highest price of the 50 states. In fact, California gas prices are now well above $5. The cheapest gas in the country can be found in Missouri, Oklahoma, Kansas, and Arkansas all with prices in the $3.60 range.
As for which states have seen prices rise the most dramatically, those East of the Mississippi have all seen prices rise by over $0.50 over the last month; Alabama (+$.75) and Rhode Island ($+0.74) marking the largest increases in dollar terms. On the West Coast, California and Nevada also have seen price increases over the past month that are larger than the average for the whole country ($0.60).

As prices surge and will likely weigh on the average American’s budget, consumers are understandably looking for a deal where possible. In the charts below, we show Google Trends data for the search terms “Gas Prices”, “GasBuddy”, “Cheap Gas”, and “Cheap Gas Near Me.” Google’s indices index the period which searches for a given term were the most popular to 100. Thus a reading of 75 would be when interest was three-quarters of the peak, 50 would be a time that searches were half of the peak, and so on. As shown, each of these terms has taken off this month and is at or approaching record highs. For the broadest search of “Gas Prices,” September 2005 was the only time search interest was more elevated. “Cheap gas” has also made a sharp move higher hitting levels last seen over a decade ago. A perhaps more actionable search of “Cheap gas near me” meanwhile is at the highest level ever by a massive margin. Searches for the app “GasBuddy” which helps to find the gas stations with the lowest prices around a user’s area has also made an explosive move higher. The only points in time with higher readings in the index were last May and September 2017. Click here to view Bespoke’s premium membership options.

Biden a Boon for Energy
This morning we updated our key ETF performance matrix to see how various asset classes have performed since President Biden was elected back in November 2020 and since Inauguration Day in January 2021. In the matrix below, we also include performance over the last six months, which has been downright awful for most areas of financial markets outside of the commodity space.
Since Election Day 2020, the S&P 500 (SPY) has posted a strong total return of 30.7%, with Value outperforming Growth significantly across all market cap ranges. Looking at US sector ETFs, Energy (XLE) has absolutely walloped every other sector. As shown, XLE is up 173% since President Biden was elected, while the next best sector has been Financials (XLF) with a gain of 51%. Outside of the US, country ETFs like China (ASHR), Germany (EWG), and of course Russia (RSX) are in the red since Election Day 2020, while Canada (EWC) and Mexico (EWW) are up the most at 45% (15 percentage points better than SPY).
The broad commodities ETF (DBC) is up 109% since Election Day, with oil (USO) up 198%, agriculture (DBA) up 50%, gold (GLD) up just 3%, and silver (SLV) up 4.8%. Fixed-income ETFs have posted negative total returns since Biden was elected, with the 20+ Year Treasury ETF (TLT) down the most at -10%.
Returns are much weaker since Inauguration Day on 1/20/21. SPY is still up 13.9% since then, but the Nasdaq 100 (QQQ) is up just 4.8% and the Russell 2,000 (IWM) is down 6%. Looking at sectors, Energy (XLE) is easily on top with a gain of 82%. Over this same time period, Consumer Discretionary (XLY) is up just 1.9%, and Communication Services (XLC) is down 2.7%. Outside of the US, along with Russia (RSX), a number of country ETFs are down double-digit percentage points, including China (ASHR), Germany (EWG), Hong Kong (EWH), Japan (EWJ), and Spain (EWP).
Over the last six months, SPY is down 3.8%, but the Tech-heavy Nasdaq 100 (QQQ) and the small-cap Russell 2,000 (IWM) are both down more than 11%. Of the sector ETFs, Energy (XLE) is up an incredible 61.5% over the last six months, while Communication Services (XLC) is down 22.5%. The only other sector ETFs that are up over the last six months are the two main defensives — Utilities (XLU) and Consumer Staples (XLP).
Across the world, we’ve seen declines over the last six months, but Brazil (EWZ) and Canada (EWC) have bucked the trend with small gains. Commodities ETFs are solidly green, while Treasury ETFs are solidly red.
The current administration came into office solely focused on COVID, but is now facing a two-front battle against inflation and Russia’s invasion of Ukraine. Energy prices were already on the rise when the Trump administration passed the baton to the Biden administration, but things have ramped up to a completely different level over the last few months. Click here to try out Bespoke’s premium stock market research for the next two weeks.

Bespoke’s Morning Lineup – 3/7/22 – The Market’s Case of the Mondays
See what’s driving market performance around the world in today’s Morning Lineup. Bespoke’s Morning Lineup is the best way to start your trading day. Read it now by starting a two-week trial to Bespoke Premium. CLICK HERE to learn more and start your trial.
“Facts do not cease to exist because they are ignored.” – Aldous Huxley
It hasn’t been a fun morning for equity investors around the world this morning as futures have been in the red everywhere you look. German stocks, while currently off their morning lows are currently on pace to close in bear market territory. Here in the US, futures are also lower, but well off their overnight lows.
The Russia-Ukraine war continues to drive headlines, and the place it is being felt the most is in crude oil prices. While prices of WTI still remain elevated at a price of more than $118, they actually briefly traded as high as $130 in overnight trading. How desperate is the market for additional barrels of oil given the disruption of Russian supplies? This weekend, US government officials actually visited with the Venezuelan government in an effort to boost ties with a country we cut off diplomatic relations with back in 2019.
Read today’s Morning Lineup for a recap of all the major market news and events from around the world, including the latest US and international COVID trends.
Mondays (or the first trading day of the week when Monday was a holiday) have not been friendly to bulls this year. In the nine weeks so far this year, the S&P 500 has opened the day lower seven times by an average of 0.54%, and today looks like it will be the eighth). The rest of the week has also been negative, but with an average gap lower of 0.03% for all other days of the week, Mondays have been notably weak.
While stocks have opened the day lower to kick the week off, selling hasn’t necessarily followed through to the rest of the trading day. After opening down by an average of 0.54% to start the week, SPY has averaged an intraday gain of 0.42% with positive returns just over half of the time. That compares to an average intraday decline of 0.20% for all other days of the week.

Start a two-week trial to Bespoke Premium to read today’s full Morning Lineup.
Bespoke Brunch Reads: 3/6/22
Welcome to Bespoke Brunch Reads — a linkfest of the favorite things we read over the past week. The links are mostly market related, but there are some other interesting subjects covered as well. We hope you enjoy the food for thought as a supplement to the research we provide you during the week.
While you’re here, join Bespoke Premium with a 30-day free trial!
Ukraine
The bleak market outcome for Russia after Ukraine invasion by Paul McNamara (FT)
The removal of Russia from major financial markets indices is only the start of a long process of capital starvation for the country’s economy, which will have lasting and terrible consequences for Russian state capacity. [Link; paywall]
As Tanks Rolled Into Ukraine, So Did Malware. Then Microsoft Entered the War by David E. Sanger, Julian E. Barnes and Kate Conger (NYT)
Close coordination between the US intelligence community and security experts at Microsoft led to a rapid response against Russian cyberattacks in near-real time as the country sought to cripple Ukraine during the initial invasion. [Link; soft paywall]
The Terrible Truth So Many Experts Missed About Russia by Ben Judah (Slate)
Analysts and strategists across the Western world were operating under the assumption that the Russian President faced a series of constraints that he did not in fact pay any attention to. [Link]
Ripple Effects
Could Congress let you seize this Russian oligarch’s yacht? by Philip Bump (WaPo)
A downright unbelievable proposal is seeking to give private American citizens the right to seize assets of Russian oligarchs via Letters of Marque, a 19th century legal construct that hasn’t been used in almost two hundred years. [Link]
Ukraine war threatens to make bread a luxury in the Middle East by Maya Gebeily and Mena A. Farouk (Thompson Reuters Foundation)
On a combined basis, Russia and Ukraine supply a huge share of the grain that countries with relatively arid climates and weak farming capacity across the Middle East and North Africa rely on for basic calories. [Link]
State Capacity
‘Ways and Means’ Review: Financing the Civil War by Harold Holzer (WSJ)
A new book examines the role that innovative financial arrangements played in winning the Civil War for the Union, ranging from fiat currency to new debt instruments. [Link; paywall]
At cartel examination site; Mexico nears 100k missing by María Verza (AP)
Drug cartels operate with near-impunity in Mexico, and occasionally authorities discover the aftermath. One such example currently under investigation is a 75,000 square foot site miles from the border. [Link]
Former Police Chief Faked Death to Evade Charges, Officials Say by Eduardo Medina (NYT)
A small town police chief facing more than 70 felonies and fled to South Carolina after faking his death on a boat in the Lumber River. The former chief had stolen drugs and firearms from the town’s evidence locker and sold them for thousands. [Link; soft paywall]
Real Estate
L.A.’s most extravagant mansion sells for less than half its list price by Laurence Darmiento (Yahoo!/LAT)
A developer’s dream project collapsed with a mansion listed at $295mm selling for just $126mm, despite carrying a $256mm debt load from its construction. [Link]
COVID
Pfizer Covid vaccine was just 12% effective against omicron in kids 5 to 11, study finds by Spencer Kimball (CNBC)
A New York state study found a huge decline in efficacy among children during the Omicron variant surge, possibly due to lower dosages for young children compared to adults. [Link]
Economic Development
The Jolt: David Perdue targets Gov. Brian Kemp’s prized Rivian deal by Patricia Murphy, Greg Bluestein, and Tia Mitchell (The Atlanta Journal-Constitution)
Most state-level politicians would be thrilled to see $5bn invested in their state by a rapidly growing industrial company, but Georgia Governor candidate David Perdue apparently isn’t a fan. [Link]
Read Bespoke’s most actionable market research by joining Bespoke Premium today! Get started here.
Have a great weekend!
US Back on Top (Sort of)
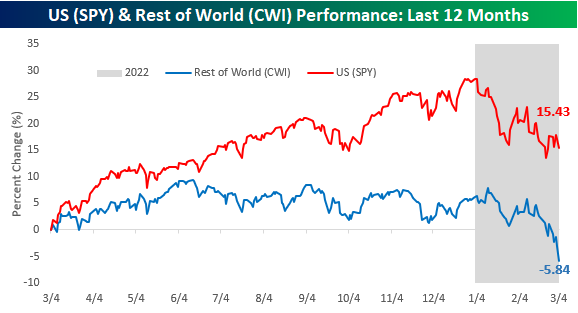
Heading into 2022, there was a ton of optimism towards international stocks. After years of underperformance, the feeling was that valuations had become so skewed in favor of international stocks that they were due for their day in the sun. When the calendar finally did flip, international stocks came out of the gate positively, and as US stocks pulled back, international stocks held up much better. The resilience of international stocks didn’t last long, though. As the Russia-Ukraine war has escalated, investors have been ditching international equities en masse, while US stocks have actually held up relatively well. Over the last year now, US stocks, as measured by the S&P 500 tracking ETF (SPY) are up over 15%. International stocks, on the other hand, as measured by the SPDR MSCI ACWI ex-US ETF (CWI) are now down over 5%!
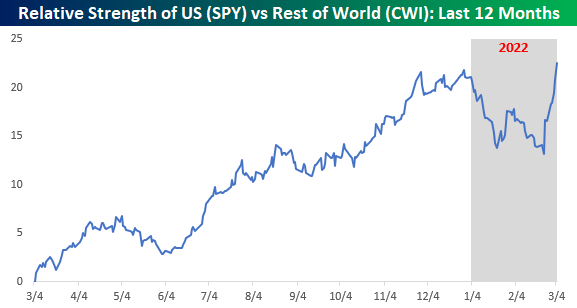
The relative strength picture between US and international stocks really illustrates how international stocks appear to have had their 15 minutes come and go. When 2021 ended, the relative strength of US stocks versus the rest of the world was right near a 52-week high. Once 2022 kicked off, though, US stocks saw a big slide in relative performance bottoming out on 2/23 – the day before Russia invaded Ukraine. Since that invasion, US relative performance has spiked higher and is right back to levels it started the year at. Investors have clearly fled to the relative safety of US stocks given the geo-political turmoil, so as long as these conditions remain, international stocks are subject to headwinds. If tensions do start to de-escalate, though, international equities may find themselves back in the spotlight again. Click here to view Bespoke’s premium membership options.
Bespoke’s Morning Lineup – 3/4/22 – The Least Important Jobs Report in Years
See what’s driving market performance around the world in today’s Morning Lineup. Bespoke’s Morning Lineup is the best way to start your trading day. Read it now by starting a two-week trial to Bespoke Premium. CLICK HERE to learn more and start your trial.
“If you’re changing the world, you’re working on important things, you’re excited to get up in the morning.” – Larry Page
Every month at about this time, the financial world stops everything to focus on what is often considered the most important jobs report in years. Today’s employment report looks like an exception, though. With Fed Chair Powell already telling the markets that March’s meeting will come with a 25 bps rate hike, the Russia Ukraine war intensifying, and commodity prices spiraling out of control, today’s report could be the least important jobs report in years.
Futures are sharply lower this morning following a big sell-off in Europe as war tensions escalate. The big headline last night was news of Russia attacking and seizing control of Europe’s largest nuclear power plant. While initial concerns of a nuclear accident have subsided, investors are coming to a realization that the longer this all drags on, the more damaging to the global economy it all becomes. European benchmark indices are currently down over 3%, while US futures are down about 1%.
Read today’s Morning Lineup for a recap of all the major market news and events from around the world, including the latest US and international COVID trends.
Rising commodity prices have been the most direct impact of the Russia-Ukraine war, and crude oil is the most concrete example. Through this morning, WTI crude oil is up just over 20% on the week, and if these gains hold through the end of the day, it would be just one of five periods where crude rallied more than 20% in a week. In 1998, it got close to 20% but came up just short. As shown in the chart below, we’d also note that three of the prior four periods where prices spiked occurred during recessions. We’re at the point now where prices at the pump are higher on the way home from work than on the way in.

Start a two-week trial to Bespoke Premium to read today’s full Morning Lineup.
Bespoke’s Consumer Pulse Report – March 2022
AAII Sentiment Improves While Other Surveys Plummet
The S&P 500 has been fighting to regain some of its lost ground in the past week working its way out of oversold territory at yesterday’s close in the process. As a result, investor sentiment has taken a more optimistic tone this week as the AAII sentiment survey showed the percentage of respondents reporting as bullish climbed back above 30% for the first time since the first week of the year. In total over the past two weeks, bullish sentiment has now risen 11.2 percentage points. While improved, that still leaves bullish sentiment several percentage points below its historical average of roughly 38%.

The gains to bullish sentiment borrowed heavily from an extremely elevated reading in bearish sentiment. Last week over half of the respondents reported as bearish after a 10.5 percentage point increase week over week. This week that has dropped all the way down to 41.4%. That 12.3 percentage point decline was the largest drop since October 2019 when it fell 12.91 percentage points to a much lower 31%. This also marks the first time bearish sentiment rose double-digits then fell double digits in back-to-back weeks since February 2016.

In spite of the big drop to bearish sentiment, they continue to heavily outnumber bulls with an 11 point spread between bullish and bearish sentiment. That is improved from last week’s reading of -30.3 but remains at the low end of the recent range.

While the AAII survey results showed an improvement in sentiment, other sentiment surveys showed the opposite. The Investors Intelligence survey saw the lowest reading on bullish sentiment since February 2016 and the NAAIM Exposure index showed investment managers are basically market-neutral as the index saw the lowest reading since the COVID crash. Combining all of these readings into our Sentiment Composite, the gains to AAII sentiment in the past couple of weeks has brought the composite off the lows, but current levels are still some of the most bearish of the past decade. The only lower readings were in the spring of 2020 and early 2016. Click here to view Bespoke’s premium membership options.

High Levels of Volatility
It’s been a volatile start to 2022 so far. With an average intraday trading range of two percentage points, the S&P 500’s average intraday range in the first 41 trading days of the year has been the widest since 2009, and the only other year besides 2009 where the average range was wider was 2008.

High levels of intraday volatility tend to coincide with periods of elevated uncertainty among investors and typically occur during periods when the market is lower. When the average daily range of the S&P 500 has been more than 1.5 percentage points during the first 41 trading days of the year, the average YTD performance of the S&P 500 was a decline of 5.7% (median: -4.3%). This significantly trails the average gain of 1.3% (median: 2.0%) of all years since 1983. So far this year, the S&P 500 has had the second-worst start since 1983 trailing just 2009, when the S&P 500 tanked 25.3% in the first 41 trading days.
Regarding forward returns after these volatile starts, returns vary. Although performance over the following one and three months tended to be better than average and more consistent to the upside, over the following six months and for the rest of the year, performance was more mixed. Click here to view Bespoke’s premium membership options.

Unusual Seasonal Strength From Claims
Jobless claims were expected to fall to 225K this week, but the decline was even larger as first-time claims fell to 215K. That marked an 18K decline from last week’s slight upwardly revised number of 233K and is the lowest level of claims since the final week of 2021.
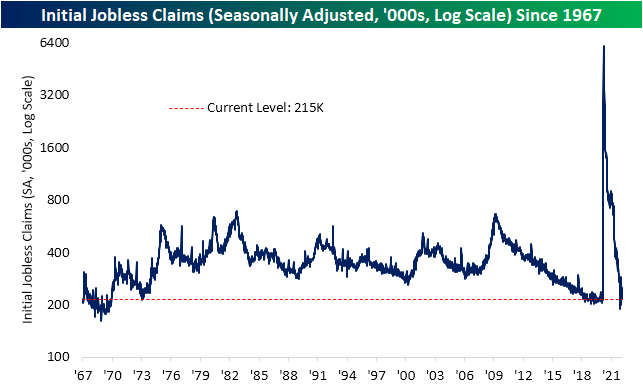
On a non-seasonally adjusted basis, it was a very impressive week. Claims dropped to 194.7K, and after revisions, it is the first sub 200K print since March 2020. That also makes for the lowest level of the current week of the year on record. The 21.3K improvement from last week is also seasonally unusual. The current period of the year has historically marked a temporary low in the average reading on claims (second chart below). Additionally, the current week of the year has infrequently seen claims fall as they did this week. Throughout history, the ninth week of the year has been one of the most consistent periods in the first half of the year to experience week over week increases in claims. In fact, historically the current week of the year has seen claims rise WoW over 70% of the time and prior to this year, the last time the current week of the year saw a lower reading on claims was 2011.

Continuing claims were less impressive this week. While last week’s reading was revised down by 2K to 1474K, this week’s number was slightly higher at 1476K. That compares to estimates of further declines down to 1420K. Even though the most recent reading disappointed, the current level of claims is still well below the range of readings from the past several decades. Click here to view Bespoke’s premium membership options.
