Dipping Dallas
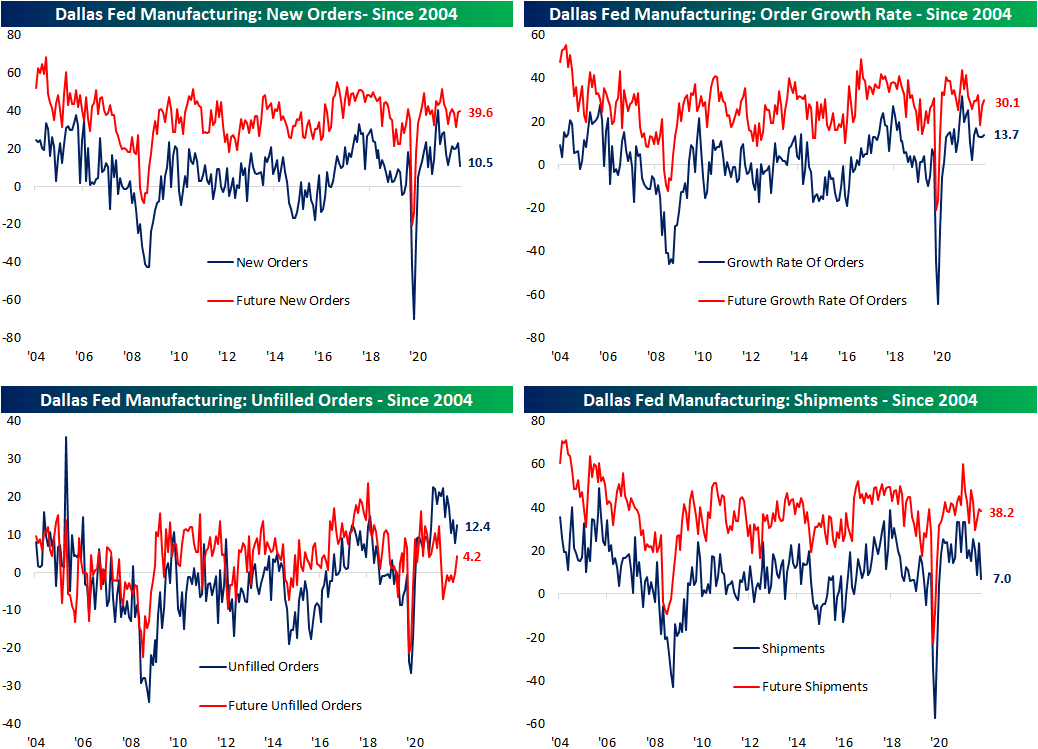
The fifth and final regional manufacturing release came out of the Dallas Fed this morning, capping off the month on a disappointing note. The index fell by more than expected, dropping 5.3 points to 8.7. While lower, that is still several points above December and January levels. The Expectations reading was also lower, setting a 21-month low.

The month over month decline in general business activity came up just shy of the bottom quartile of all readings since the data begins in 2004. In spite of that decline at the headline level, overall breadth was actually largely positive with the number of categories rising month over month doubling the number of categories that fell. With that said, company outlook, shipments, and new orders each saw significant declines. Expectations, on the other hand, had a larger share of categories decline as most of these indices sit lower within their respective historic ranges.

As mentioned above, new orders and shipments experienced two of the most notable declines this month, falling 12.6 and 16.5 points, respectively. New orders is now down to the weakest level since January 2021 while shipments has erased any gain since June 2020. While those were big declines, the positive readings still indicate that the region continues to see growing demand albeit at a slower rate.
Employment metrics were a healthier area of the report showing the region’s firms increased hiring in March at an accelerated rate. Additionally, wages and benefits also rose at a historic rate. The current conditions index for that category set a new record high this month while expectations reversed off of a record. Not only are the region’s firms paying workers more, but they are also increasing capital expenditure. That took out the December high for the strongest reading since last May. That increased spend is also expected to continue as the expectations index hit the highest level in three years. Click here to view Bespoke’s premium membership options.

Asset Class Performance by Weekday
As Vladimir Lenin once wrote “There are decades where nothing happens; and there are weeks where decades happen.” For investors, each passing day of late has felt like a month, as Powell’s Pivot, the Ukrainian conflict, rampant inflation, supply chain constraints, and COVID have caused rapid shifts in investor sentiment, leading to heightened volatility. With each day feeling like an eternity, we decided to look into the average performance by weekday to provide you with insights into trading patterns based on the day of the week.
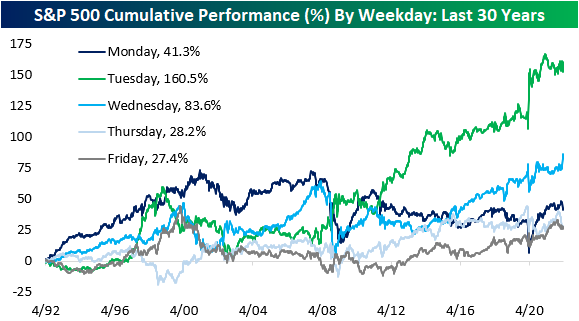
The last twelve months have seen a divergence in performance from the norms of the last 30 years. On a trailing 12-month basis, the S&P 500 has performed poorly on Mondays and Tuesdays before gaining steam from Wednesday through Friday. This diverges from the patterns seen over the last thirty years, in which Thursday and Friday struggled relative to the performance over the first three trading days of the week. This year, oil has averaged gains on every day of the week, but the strongest performance has occurred early in the week, which is interesting as Monday and Tuesday have tended to be the worst days of the week for oil over the last 30 years. Bonds have performed poorly in the beginning of the week over the last twelve months but have partially recovered in the last two trading days. Over the long run, the safe asset has traded narrowly with only Wednesdays averaging a loss. Tuesdays and Thursdays have been strong days for the US Dollar over the last twelve months, but these days tend to result in flat to negative performance when looked at over the last 30 years.


Below we summarize the cumulative performance by weekday for the S&P 500 over the last 30 years. As you can see, Tuesday has been the best performing day by far, booking performance gains of 160.5%. Wednesday has posted a cumulative gain of 83.6%, which lands the day in second place. Friday and Thursday have been the weakest days, booking a cumulative gain of just 27.4% and 28.2%, respectively. Monday lands in the middle, recording a cumulative gain of 41.3%. As outlined above, the recent shift in weekday performance deviates from the norms of the last 30 years as investors have come out of the weekend with fears but concluded the week with optimism. Click here to try out Bespoke’s premium research service.
Bespoke’s Morning Lineup – 3/28/22 – New Week
See what’s driving market performance around the world in today’s Morning Lineup. Bespoke’s Morning Lineup is the best way to start your trading day. Read it now by starting a two-week trial to Bespoke Premium. CLICK HERE to learn more and start your trial.
“The way to crush the bourgeoisie is to grind them between the millstones of taxation and inflation.” – Vladimir Lenin
What was looking like a positive start to the week has taken a turn for the worse as US equity futures have given up much of their earlier gains in the last few minutes. It’s been a quiet morning so far in terms of economic data, and the only real fireworks are taking place at the short end of the Treasury curve and in the crypto space as bitcoin trades above $47K to its highest levels of the year. On the war front, Russia’s stalled advance has that country now narrowing its focus to the ‘liberation of Donbas’ so there is some optimism that talks this week could lead to some sort of peace breakthrough. It’s the last several days of what has been a very volatile quarter, so don’t be surprised to see more of it as we close out the quarter.
Read today’s Morning Lineup for a recap of all the major market news and events from around the world, including the latest US and international COVID trends.
US stocks are still well off their highs from late 2021 and early 2022, but in the short-run, most are either close to or at short-term overbought readings. The S&P 500 moved into overbought territory last week for the first time since January 4th, and at current levels is just shy of taking out its early February highs – a level it stalled out twice at in the first ten days of February.

Start a two-week trial to Bespoke Premium to read today’s full Morning Lineup.
Bespoke Brunch Reads: 3/27/22
Welcome to Bespoke Brunch Reads — a linkfest of the favorite things we read over the past week. The links are mostly market related, but there are some other interesting subjects covered as well. We hope you enjoy the food for thought as a supplement to the research we provide you during the week.
While you’re here, join Bespoke Premium with a 30-day free trial!
Ukraine
Why Russia is Losing: Gen. David Petraeus on the War in Ukraine by Jonathan Tepperman (The Octavian Report)
Former US CENTCOM and coalitions forces chief in Afghanistan (as well as CIA director during the Obama Administration) David Petraeus discusses the most important of myriad Russian military failings in its invasion of Ukraine. [Link]
Russia says new ‘phase’ of Ukraine offensive to focus on Donbas by Polina Ivanova, Henry Foy, and Roman Olearchyk (FT)
With Kyiv defended, Odessa out of reach, Kherson under assault from Ukrainian forces, Mariupol still unconquered, and little movement in Russian lines elsewhere, the Russian Ministry of Defense announced Friday that it was pivoting to focus on “liberating” the entirety of Donbas Obkast, a near-explicit admission of defeat. [Link; soft paywall]
Energy
Russia‘s Energy Shock by Nick Birman-Trickett (OGs and OFZs)
A long read on the history of Russia’s economy and energy sector and its role in the broader economy of the country. Chock full of interesting tidbits and details on just how painful the transition away from integration in the global economy is. [Link]
U.S. to Boost Gas Deliveries to Europe Amid Scramble for New Supplies by Matthew Dalton and Giovanni Legorano (WSJ)
US liquid natural gas shipments will help fill some of the gap of disrupted supply from Russia, with the Biden Administration planning to ship at least 50bn cubic meters (more than double last year’s numbers) across the Atlantic through at least 2030. [Link; paywall]
ExxonMobil Running Pilot Project to Supply Flared Gas for Bitcoin Mining: Report by Aoyon Ashraf (CoinDesk)
Natural gas flaring off ExxonMobil oil wells in North Dakota is going to be used to power bitcoin mining rigs, turning waste gas in to an income-producing asset. [Link]
Short Sellers
A Top Prosecutor, a Short Seller’s Confession, and a Columbia Professor Offer Clues to the DOJ Probe of Short Sellers by Michelle Celarier (II)
Evolving securities laws are making for some confusing designations in cases of market manipulation, which raise even more existential questions than usual when it comes to the thorny territory of what kind of speech is legal when it comes to markets. [Link]
An Alleged Fraud Uncovered by a Short Seller Ends in Gunfire by Ben Foldy (WSJ)
When the FBI showed up to investigate a potential Ponzi scheme in Las Vegas, the suspect shot at agents and was wounded multiple times; eventually a SWAT team was able to take him in to custody. [Link]
Demographics
Signet Jewelers Says Weddings Will Hit a 40-Year High This Year by Jeannette Neumann (Bloomberg Quint)
Jeweler giant Signet (which owns Kay and Zales) is forecasting the largest number of weddings in four decades as a backlog of nuptials from the pandemic is cleared out. [Link]
Deaths outpace births in most counties as U.S. growth slowed in 2020 by Fredrick Kunkle (WaPo)
While births continued to outpace deaths nationally, falling fertility rates and surging deaths thanks to the pandemic led to three-quarters of the country’s counties reporting more deaths than births in the past year. [Link; soft paywall]
Mystery driver of red truck driving through Texas tornado is a teenager by Amanda Ruiz (Fox 7 Austin)
A red Chevy that was spun dramatically by a tornado in Elgin, TX was driven by a 16 year old Whataburger job applicant on his way home. [Link]
Aerospace
Chinese Boeing jet crashes in mountains with 132 on board, no sign of survivors by Martin Quin Pollard (Reuters)
Earlier this week a Boeing 737-800 NG operated by China Eastern Airlines fell from an altitude of more than 30,000 feet to a brutal crash in southern China. [Link; soft paywall]
Everything to know about Switchblades, the attack drones the US is giving Ukraine by Kelsey D. Atherton (Popular Science)
Everything you didn’t realize you needed to know about the infantry-portable “Switchblade” drones that are part of the lethal aide package that the United States has sent to Ukraine. [Link]
Read Bespoke’s most actionable market research by joining Bespoke Premium today! Get started here.
Have a great weekend!
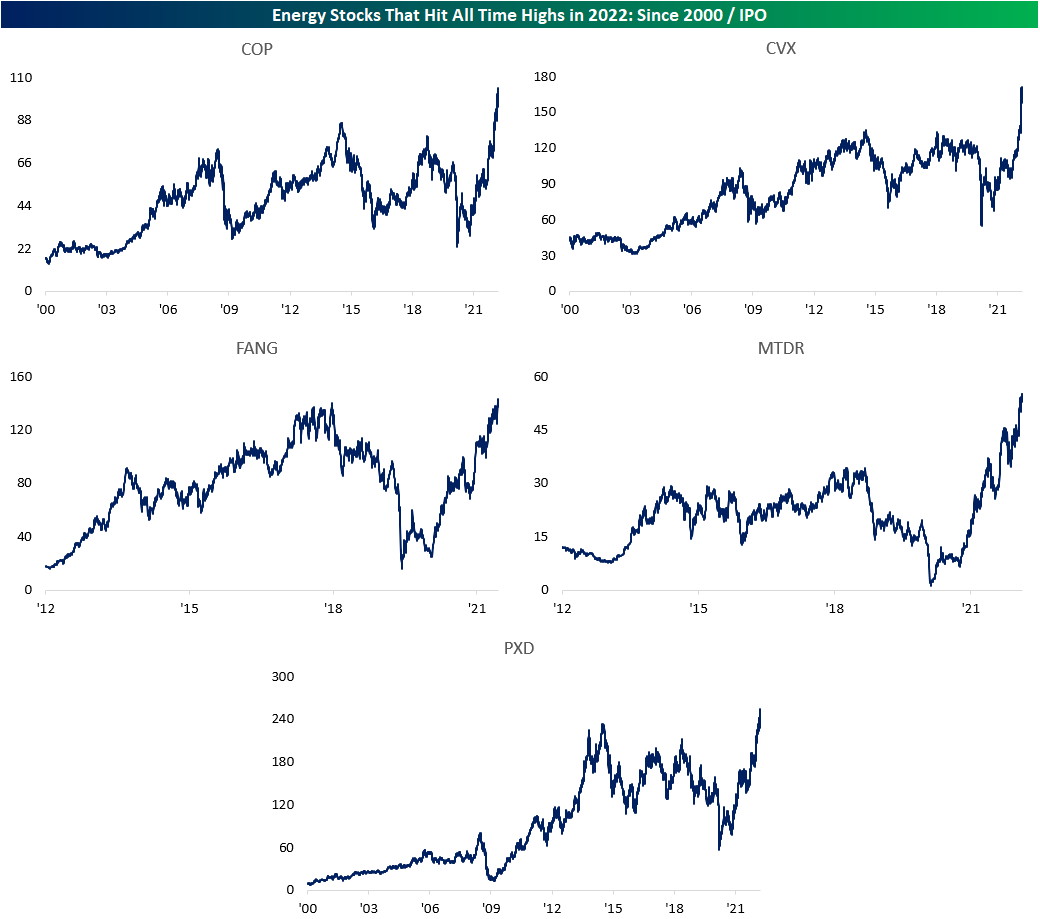
5 Energy Stocks Reached ATHs
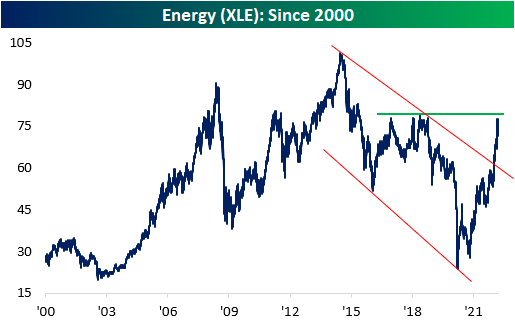
Energy stocks have roared higher since the beginning of 2022, gaining a whopping 38.8% in less than three months (as of yesterday’s close). This comes on the back of sharp moves higher in crude, thus implying higher margins and increased bottom line earnings per share. During the pandemic, energy stocks were among the most hurt, as a reduction in travel and economic activity led to a crash in oil markets. Although the YTD gain is certainly substantial, investors that have held energy stocks since mid-2008 are still in the red. The energy sector ETF (XLE) is still 23.0% off of its high price since the turn of the century, which occurred in June of 2014. As you can see from the chart below, XLE has broken its long-term downtrend and is nearing a breakout above 2018 levels. To retest the high of the century, XLE would need to gain another 29.8%.
On March 11th of this year, the relative strength reading of XLE vs the S&P 500 (SPY) since 2000 turned positive for the first time since COVID was declared a pandemic by the World Health Organization (WHO). The ratio has since turned negative, and the reading is currently -5.0 percentage points. The relative strength had moved continuously lower from its high in 2008 through early 2021, but the recent reversal higher is substantial.

Although Energy has been strong as of late, only five of the 63 Energy sector stocks in the S&P 1500 have hit all time highs in 2022 (to be considered, the stock must have been trading for at least five years). The five stocks are ConocoPhillips (COP), Chevron (CVX), Diamondback Energy (FANG), Matador Resources (MTDR) and Pioneer Natural Resources (PXD). Below are the charts of these stocks since the turn of the century. The average stock on this list is up 41.3% on the year as of yesterday’s close, which is only slightly greater than the performance of XLE. Click here to try out Bespoke’s premium research service.
Country Performance Since COVID-Low
Earlier this week, we looked at US sector and individual stock performance since the COVID-low to give our readers a perspective on the huge moves seen since March 23, 2020. Today, we are looking into the performance of each major country ETF since the COVID-low to show you the differentiation across the globe for US investors. COVID impacted each country differently for a variety of factors. First, government responses differed greatly. Countries like China, Australia and Canada have been excessively restrictive, while most European countries were less stringent (with a few notable exceptions). Click here to view a “stringency” index generated by Our World in Data.
The second economically-impacting factor that has led to divergent equity performance has been buying power. With supply chain and inflation headwinds, poorer nations simply cannot compete for goods, as the order value ticked higher due to strong global demand and a constrained supply chain. These nations were essentially out-bid for everything they needed, be it food, gas, or durable goods.
A third factor is the mix of goods and services exported by each nation. Countries that are primarily commodity exporters (like Brazil and Australia) struggled initially, but have benefitted substantially as their average selling prices have soared. On the other hand, countries reliant on commodity imports have suffered, as the sky-rocketing of input costs dampens production and economic activity.
We could go on and on about all of the factors that impacted economic growth on a country-by-country basis. Needless to say, the performance in equity markets across the globe has varied greatly. Of the major country ETFs that we tracked, Canada has been the strongest performer since the COVID-low, largely due to their economic mix of commodity and services exports with very little manufacturing exposure (relative to comparable nations). Canada is close to self-sufficient in terms of inputs, as it is a commodity-rich nation. This holds true for Australia as well. Only Canada (EWC), Mexico (EWW), India (PIN) and Australia (EWA) have outperformed the US (SPY) since 3/23/20. Mexico benefitted from a shifting in the manufacturing environment, as port congestions and general supply chain woes pushed the US to ramp up Mexican imports. As labor became more and more expensive, an increasing number of corporations outsourced SG&A functions to India, which helped spur economic activity.
The worst performers have been Hong Kong (EWH), China (ASHR), Spain (EWP) and Japan (EWJ). China and Hong Kong have been negatively impacted by political fears, as China pushes for US-delisting and Hong Kong has seen its independency slowly fade. The table below summarizes the performance since the COVID-bottom (3/23/20) and on a YTD basis. As you can see, the top performer YTD by a substantial margin is Brazil, as their economy is highly concentrated into energy-related commodities.
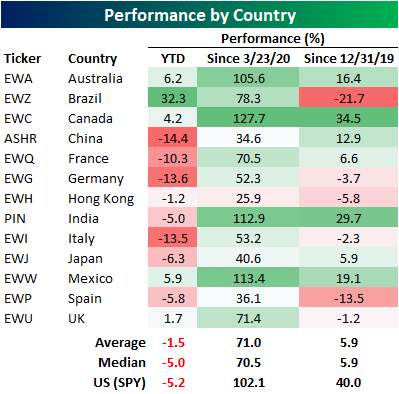
Below is a set of graphs that shows the performance of each country listed above since the end of 2019 just before COVID hit. While the US (SPY) is well above where it ended in 2019, many country ETFs are actually down since then. These include Brazil (EWZ), Germany (EWG), Hong Kong (EWH), Italy (EWI), Spain (EWP), and the UK (EWU).
If you have an interest in learning more about Emerging Markets, we recently released the Bespoke Emerging Market 50, which tracks 50 ADRs domiciled in emerging economies that have either experienced strong earnings growth over the last several years, are positioned to recover substantially, or have unique upside due to the geopolitical environment. Click here to try out Bespoke’s premium research service, which will grant you access to the Bespoke Emerging Market 50.

Slight Disconnect Between the VIX and Volatility
The CBOE Volatility Index (VIX) was invented to allow investors to speculate about volatility over the next 30 days. The VIX is commonly referred to as the fear index, and readings above 20 tend to occur in uncertain times filled with concern, while readings below 20 indicate a perceived relatively low-risk environment. As of late, the average intraday range of the S&P 500 has been quite high, with the last 30 trading days averaging a trading range of 2%, which is on the high side relative to history. In fact, the 30-day rolling average percentage spread between intraday highs and lows did not cross 2% throughout the entirety of 2021, but on the first day of February 2022, we broke a 440 trading day streak in which the reading was below 2% that had bene in place since the days coming out of the COVID crash.

As depicted below, the VIX tends to spike during times in which market volatility increases. However, the current elevated level of intraday volatility has not been matched with a proportional rise in the VIX. Based on historical data, the VIX should currently be closer to 26.5, but the current reading of 21.8 is 17.6% below the implied value we would derive from the last 30 days of intraday volatility alone. This suggests that although the market has been shaky as of late, investors expect an easing of that volatility in the near future. Click here to view Bespoke’s premium membership options.

Bespoke’s Morning Lineup – 3/25/22 – Semis Roll
See what’s driving market performance around the world in today’s Morning Lineup. Bespoke’s Morning Lineup is the best way to start your trading day. Read it now by starting a two-week trial to Bespoke Premium. CLICK HERE to learn more and start your trial.
“Your information sources should complement one another, and also be redundant because that gives you a way to verify what you’ve learned.” – Andrew S Grove
It almost took an entire quarter but the S&P 500 is on the cusp of its first back-to-back weekly gains in all of 2022. For the Nasdaq, a positive finish to this week would be the first back-to-back weekly gain since November. Futures are currently indicated higher, and the only economic reports on the calendar are Pending Home Sales and Michigan Confidence. Pending Home Sales are expected to bounce back modestly following January’s surprise decline of 5.7%. Michigan Confidence, meanwhile, has been one of the most disappointing economic series of the last several months as it’s well below its COVID lows and at levels last seen in late 2011 and before that the Financial Crisis.
Markets in Europe are modestly positive with the major benchmark indices up between 0.5% to 1.0%. despite weaker than expected sentiment readings in Germany and Italy, while UK Retail Sales unexpectedly declined. Treasury yields in the US are higher again today with the 10-year up to 2.36% while the 5-year is even higher at 2.40%. Crude oil is down another 2% sending WTI down to $110 per barrel, gold is modestly lower, and bitcoin is trading above $44,500.
Read today’s Morning Lineup for a recap of all the major market news and events from around the world, including the latest US and international COVID trends.
Yesterday was a good day for the equity market, but it was especially strong for semiconductors as the Philadelphia Semiconductor Index (SOX) rallied close to 5%, and every stock in the index was up at least 2%!. In the process of Thursday’s rally, the SOX finished the day above its 50 and 200-day moving average for the first time since January and also managed to close back above its highs from last Summer (red line).

We watch the relative strength of the SOX versus the S&P 500 as it has historically been a good leading indicator of the broader market. On the positive side, yesterday’s rally broke the most recent downtrend that has been in place since mid-January, but it came up just short of taking out the high end of last summer’s range.

One thing the SOX has been this year is volatile. Over the last 50 trading days, the index has seen an average daily move of more than 2.5%. That ranks as the highest average daily change since the COVID crash (when it went much higher), and before that, you’d have to go all the way back to the financial crisis to find the last time daily volatility in the SOX was as high as it is now. In the post-dot-com era, this kind of volatility for semiconductors has been extremely uncommon.

Start a two-week trial to Bespoke Premium to read today’s full Morning Lineup.
The Closer – Peso Push, Distributional Discussion, Roaring Capex – 3/24/22
Log-in here if you’re a member with access to the Closer.
Looking for deeper insight into markets? In tonight’s Closer sent to Bespoke Institutional clients, we begin tonight with a look at EMFX performance followed by a rundown of the Federal Reserve’s quarterly update of Distributional Financial Accounts data. We also show the differing performance of investors by generation. We then take a look at quarterly equity market issuance and retirement data, preliminary durable goods figures, and the 10 year TIPS reopening.

See today’s post-market Closer and everything else Bespoke publishes by starting a 14-day trial to Bespoke Institutional today!
Record Readings From The KC Fed
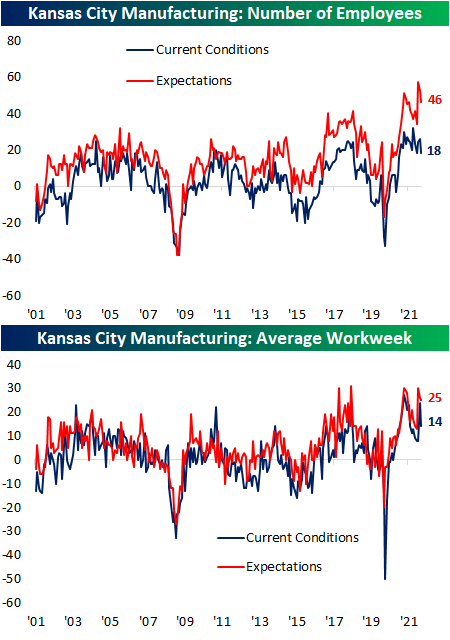
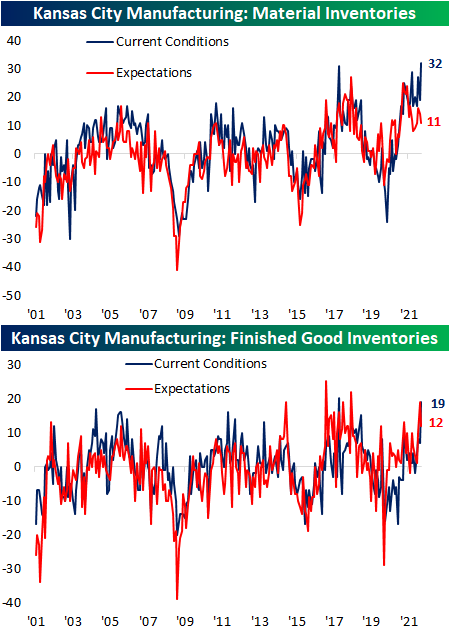
The fourth of five regional Fed manufacturing indices was released this morning from the Kansas City Fed. The 10th district’s Manufacturing Composite hit a new record high in March rising 8 points to 37. Expectations also set a new record climbing 3 points to 41. Those readings indicate the region’s manufacturers have seen a historic rate of growth and expect that to continue over the next six months.

Given the record reading in the headline index, most categories of this month’s report came in at historically elevated readings. Breadth was also impressive with only three categories declining month over month: Number of Employees, Average Workweek, and New Orders for Exports. In spite of those declines, the levels are consistent with healthy growth. Breadth for expectations was more mixed with an equal number of categories rising and falling versus the February report.

Growth in demand only accelerated modestly as the new orders index rose a single point to 33, and order backlogs rose by a more significant 7 points. The ability of the region’s manufacturers to fulfill those orders, meanwhile, was much stronger in March as both shipments and production set new record highs rising 22 and 15 points, respectively. Production expectations also set a new record high.

That higher production also came in spite of supply chain slowdowns. The delivery times index rose back up to the November record high of 55, erasing any of the past few months’ improvements. The expectations index saw the same results in which any recent reversal lower has now been erased as it set another record high.

Similar to delivery times, a huge month-over-month increase in prices paid this month led the index to reverse much of the past year’s decline, though, that was preceded by a large increase in expectations last month. The prices received index has been more rangebound recently but it too ticked higher in March. That is while expectations are rising at a much more rapid rate, setting more all-time highs.

In spite of higher prices paid and supply chain delays, material inventories experienced record builds in March as that index took out the former record from October 2017. Finished good inventories, meanwhile, came up one point shy of its October 2017 record.
The only notably weak area of the report was employment metrics. Both number of employees and average workweek remain in expansionary territory but pulled back in March for both current conditions and expectations. Click here to view Bespoke’s premium membership options.