Continuing Claims At The Lowest Level Since 1969
Whereas last week’s release of initial jobless claims set a new multi-decade low, this week that number was revised up by 1K. That means last week’s revised reading of 188K matched the December low. Turning to this week, claims came off that low rising 14K. Albeit higher, at 202K initial claims remain at historically strong levels.

On a non-seasonally adjusted basis, claims had another sub-200K showing after rising 13.2K week over week. In terms of seasonality, the current week of the year has historically seen unadjusted claims fall sequentially more often than not, and the following couple of weeks have tended to see a seasonal uptick in claims. In other words, we’re likely to see claims rise on account of seasonal factors in the coming weeks.
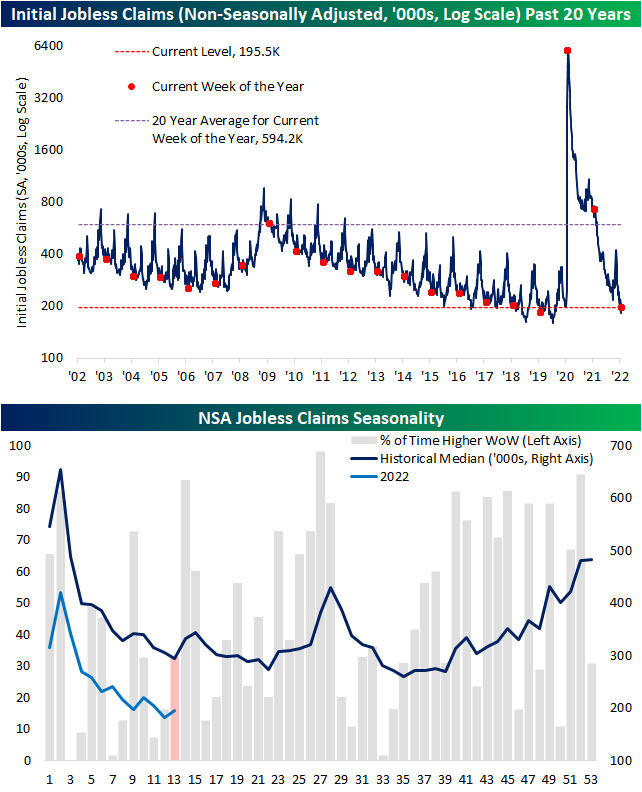
Delayed one week to initial claims, the continuing claims number was the most impressive part of the most recent release. Coming in just above 1.3 million, seasonally adjusted claims hit the lowest level since the final week of 1969. Click here to view Bespoke’s premium membership options.

Bespoke’s Morning Lineup – 3/31/22 – Au Revoir
See what’s driving market performance around the world in today’s Morning Lineup. Bespoke’s Morning Lineup is the best way to start your trading day. Read it now by starting a two-week trial to Bespoke Premium. CLICK HERE to learn more and start your trial.
“I ought to be jealous of the tower. She is more famous than I am.” – Gustave Eiffel
133 years ago today, the Eiffel Tower, one of the most iconic landmarks in the world today opened for business. It may sound hard to believe, but when the tower first opened a number of critics thought it would be an eyesore on the Paris landscape, and twenty years after it opened the Eiffel Tower was almost demolished when the lease on the land it stood on expired. The main reason it was spared was because of its utility as a radio antenna! More than 100 years later, the mere thought of Paris without the Eiffel tower would be considered a sacrilege. Just like in the stock market and everything else in life, one person’s (or generation’s) trash is another one’s treasure.
In markets this morning, investors want nothing to do with oil as WTI is trading down more than 5% on reports of a massive stockpile release from the US Strategic Petroleum Reserve (SPR). For more on this and how the SPR works, make sure to check out our explanation in today’s Morning Lineup. The weakness in futures has equity futures up modestly, but it’s the last day of the quarter, so expect to see a decent amount of volatility throughout the trading day.
In economic news, we just got a slug of economic data this morning, and there weren’t that many major outliers. Perhaps the biggest outlier was Personal Spending which rose 0.2% versus forecasts for an increase of 0.5%.
Read today’s Morning Lineup for a recap of all the major market news and events from around the world, including the latest US and international COVID trends.
There’s still a day left in the quarter, and despite the strong rally in the last couple of weeks, for the majority of stocks and sectors, it has been a quarter to forget. On a year-to-date basis, Energy is the clear leader with a gain of more than 40%, but over the last week, both Utilities and Financials have moved into positive territory for the year. At the other end of the spectrum, Communications Services, Consumer Discretionary, Technology, and Real Estate are all still looking at losses of more than 5%. Not great, but it could have been a lot worse were it not for the 3.5%+ gains in the last week.
While the vast majority of sectors are looking at YTD declines to close out Q1, they’re also trading at short-term overbought levels. All eleven sectors are currently above their 50-DMAs, and all but Financials and Communication Services are also ‘overbought’ (at least one standard deviation above their 50-DMA.

Start a two-week trial to Bespoke Premium to read today’s full Morning Lineup.
Strong Performance at the Tail Ends of Breadth
While the index turned lower today on weaker breadth, the recent rally for the S&P 500 has come on strong breadth resulting in the 10-day advance/decline line to surge to some of the highest readings on record. Monday and Tuesday saw 99th percentile readings in the 10-day A/D line and even after the decline today, the current reading remains in the 96th percentile. At Monday’s high, the 10-day AD line reached the most elevated level since October 2020. On a sector level, in the past week Financials, Health Care, Materials, Real Estate, and Tech also all saw 99th percentile readings in their own 10-day advance-decline lines.

In the matrix below, we show the average forward performance of the S&P 500 broken down by the percentile range that the index’s 10-day AD line is in. Generally, lower readings in the 10-day AD line have been followed by stronger returns whereas higher readings have been followed by weaker returns. That is, except for the most elevated readings. Readings in the upper decile have actually been followed by more consistently positive and stronger than normal average returns for the S&P 500. In other words, strong breadth is typically a more negative signal for the S&P 500 going forward, but an extremely strong breadth reading has actually been positive.

High Tax Home Price Appreciation Catching Up
In last night’s Closer, we discussed recent trends in apartment and home prices. Case-Shiller data reported yesterday showed home price appreciation ramped back up in December and January with 15% annualized growth. That is a much slower pace compared to the 26% annualized appreciation back at the post-pandemic peak last spring but is still extremely high by any standard.
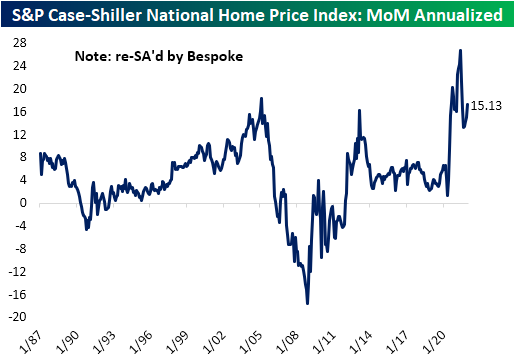
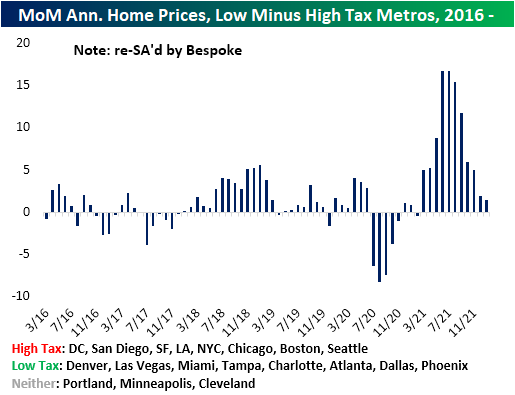
That appreciation has not been evenly felt across the country though. Since home prices inflected higher in the middle of 2020, four metros have been appreciated by more than 40% while Washington, Chicago, and Minneapolis are up at about half that price. In total, national home prices have risen almost 30% since the surge began or 18% annualized. It is worth noting that this data does not include the massive surge in mortgage rates that started at the end of last year which means that it is very unlikely that housing demand (and therefore home prices) can continue to run at such extreme levels given the huge hit to affordability brought on by higher rates.

Taking a more granular look at various metros, the huge surge in home prices had been more pronounced in lower-tax states relative to higher-tax states. But that trend has been unwinding. Click here to view Bespoke’s premium membership options.
Tesla (TSLA) Closing in on Two Facebooks (FB)
Along with the rest of the market, two of the largest stocks, Tesla (TSLA) and Meta Platforms (FB), have been on substantial rallies this month. In the case of TSLA, the stock is roughly 10% away from its 52-week high after rising ~45% since its late February low. Facebook/Meta Platforms, on the other hand, peaked back in September with a massive drop in response to the last earnings report in February being the pinnacle of those declines. Losses continued until it put in a low on March 14th. Since then, the stock has rallied 22% but that still leaves it down over 40% from its 52-week high.
As shown below, Facebook had a much larger market cap than Tesla throughout the 2010s, but the 2020s have seen Tesla take the lead in a big way. While both have been members of the “trillion dollar market cap” club at various points in time, only Tesla holds that distinction right now. At the moment, Tesla’s market cap sits at nearly $1.15 trillion, while Facebook is just above the $600 billion level.
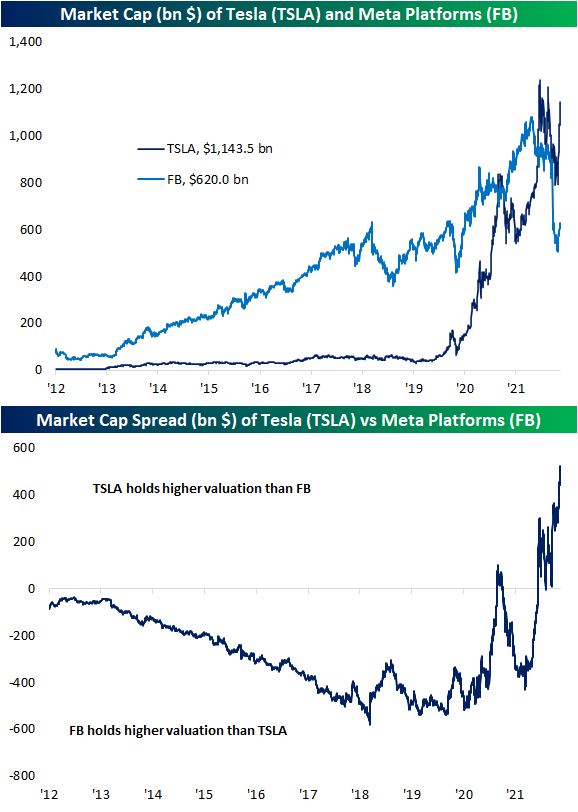
Below we show the ratio of the market caps of TSLA and FB. As shown, the massive distancing of the two stocks’ market caps means the value of Tesla (TSLA) is closing in on being worth 2 whole Facebooks. Click here to view Bespoke’s premium membership options.

Refinancing Plummets As Rates Continue to Rise
Mortgage rates continue to hone in on 5% as the reading on the national average of a 30-year fixed-rate mortgage via Bankrate.com hit 4.89% yesterday. That puts mortgage rates at the highest level since the spring of 2011. The extremely rapid 1.64 percentage point rise in rates over the past year also now stands as the largest year over year jump going back to at least the late 1990s per this data.

Given rates continue to climb, refinancing looks less attractive. The weekly reading on refinance applications from the Mortgage Bankers Association (MBA) has fallen over 14% two weeks in a row bringing the index to the weakest level since May 2019.

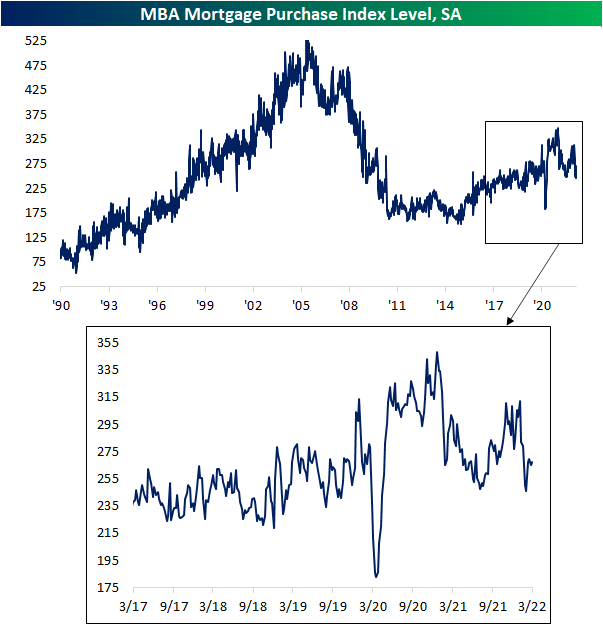
Purchase applications have also fallen to the low end of the post-pandemic range, though, there was a rebound this month with only last week seeing a decline followed by a minor uptick this week. While peaked, the current level of purchase applications is relatively healthy compared to other post-housing crisis years.
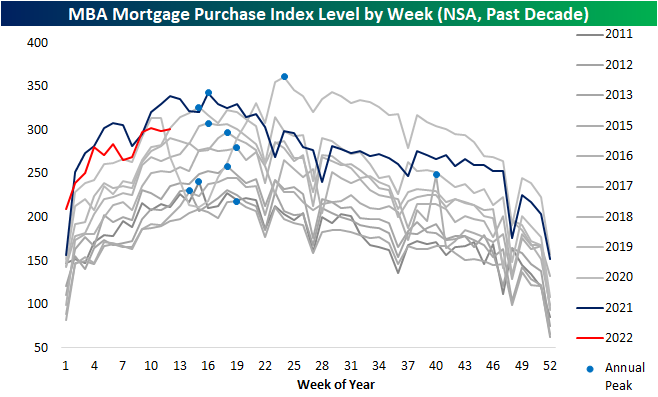
Taking a slightly different look at the data, in the chart below we show the non-seasonally adjusted purchase indices over the past decade. The first few months of the year tend to see purchases rise before hitting an annual peak (blue dots in chart below) sometime in mid-spring. Within the next several weeks, that seasonal peak is likely to be put in place. As mentioned above, while purchases are still running at the high end of the past decade, most of this year has run below last year’s pace, and that is likely to continue if not become more pronounced given the hit to affordability via higher rates and low inventories.
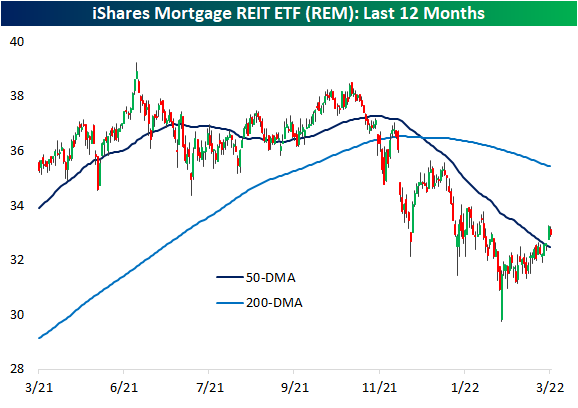
As for housing adjacent stocks, two ETFs have seen very different developments recently. As shown below, the iShares Home Construction ETF (ITB) set 52-week lows last week and with this week’s rebound it only hovers slightly above those levels. Mortgage REITs, proxied by the iShares Mortgage REIT ETF (REM), meanwhile, have actually been rallying off of 52-week lows set further back in February. That rally has broken the downtrend of the past several months and brought REM back above its 50-DMA. Click here to view Bespoke’s premium membership options.

Bespoke’s Morning Lineup – 3/30/22 – Damn the Torpedoes
See what’s driving market performance around the world in today’s Morning Lineup. Bespoke’s Morning Lineup is the best way to start your trading day. Read it now by starting a two-week trial to Bespoke Premium. CLICK HERE to learn more and start your trial.
“Damn the torpedoes. Four bells, Captain Drayton, go ahead. Jouett, full speed.” – Admiral David Farragut
In today’s edition of never put a lot of trust in headlines coming out of the Russia-Ukraine war, after yesterday’s optimistic tone regarding a potential ceasefire, reduction of Russian troops, and even the possibility of a meeting between Putin and Zelenskyy, this morning much of that optimism has been walked back as the withdrawal of Russian troops appears to have been a mirage, and Zelenskyy is claiming that Russia is sending in new forces.
Across most asset classes, we’re seeing a reversal of yesterday’s moves with US equity futures down across the board and oil trading higher. In Germany, they’re even starting to talk about the possibility of rationing natural gas.
In economic data today, the ADP Private Payrolls report was pretty much right in line with forecasts while the second revision to GDP rose 6.9% which was slightly weaker than expected.
Read today’s Morning Lineup for a recap of all the major market news and events from around the world, including the latest US and international COVID trends.
Following yesterday’s rally and the big bounce we have seen since the recent lows, we wanted to provide a quick look at all of the major index ETFs based on market cap. Moving from smallest to largest, both the Russell Micro-Cap Index (IWC) and the Russell 2000 (IWM) have broken their downtrends that have been in place since late 2021 after making a number of higher lows. In the mid-cap space, the S&P 400 (MDY) has also made a number of higher lows and taken out its early February high, but yesterday’s rally stopped out just shy of the intermediate-term downtrend.
Moving on to the large-cap side of the spectrum (bottom two charts), both the Nasdaq 100 (QQQ) and S&P 500 (SPY) look very similar to each other (probably because they are dominated by the same companies), and yesterday’s advance in both indices took out the highs from the short-term ‘double top’ in early February.
While technicals often have a way of looking good until they don’t, we’d be remiss not to note that the technical picture for the market looks rather impressive especially when you consider the fact that inflation is rampant, the FOMC is hiking rates, and there’s a war in Europe. Paraphrasing Admiral Farragut’s comments from the Battle of Mobile Bay back in August of 1964 during the Civil War, damn the torpedoes. Full speed ahead.

Start a two-week trial to Bespoke Premium to read today’s full Morning Lineup.
Speculators Step Away From the S&P
As we do each Monday, in last night’s Closer we recapped the latest data out of the Commitments of Traders (COT) report from the Commodity Futures Trading Commission. The report’s data is through last Tuesday and provides a breakdown of open interest for futures and options, though for our purposes we look at only the futures data.
By far the most notable area of last week’s report was the massive decline in net longs for S&P 500 futures. Extending a string of four straight weeks of declines, the percent of open interest went from a high of 9.96% net long one month ago to a low of 2.57% net short per last week’s data. Of those weekly declines, last week’s 6.52 percentage point drop was by far the largest. In fact, it was the biggest one week decline in net positioning since the week of 3/22/11. As shown in the second chart below, declines of more than 5 percentage points have been very rare in the post-financial crisis years, but in the late 1990s and early 2000s, large week-over-week moves were much more commonplace.

Part of the reason for this was overall open interest reported by the CFTC was much lower prior to the mid-2000s, and since around 2007 open interest has been pretty rangebound. With that said, the past several months have seen open interest steadily decline. Typically, the final weeks of a quarter experience significant seasonal declines in open interest, and while that has been playing out in recent weeks, it has left open interest at the lowest levels for S&P 500 futures since June 2008. In other words, not only has positioning data shown speculator sentiment has taken a sharply bearish turn in recent weeks, but that comes as overall open interest has fallen substantially even if some of that decline is seasonal.

Going back to the start of the data in 1997, there have been 109 weeks (including last) in which positioning has fallen by at least 5 percentage points. In the table below, we show the 16 occurrences of those that have at least 3 months between the prior instance. The most recent occurrence is middling in terms of where net positioning stands and how large of a decline it was. For example, the mid-2000s saw net short positioning in the mid-teens and those occurrences in the late 1990s and the first few years of the 2000s actually saw net long readings at the time of those declines; those declines were also some of the largest of these occurrences.
As for how stocks have done following these major shifts in positioning, the S&P 500 has managed to consistently move higher in the following week and month with larger than normal gains. Three months out, however, have seen median declines with positive performance less than half the time. Returns six months and one year out have been more consistently positive, but the median gains have been smaller than the norm. Based on prior experiences, large declines in speculator net positioning have implied mixed forward returns for the S&P 500 Click here to view Bespoke’s premium membership options.

Bespoke’s Morning Lineup – 3/29/22 – Apple’s (AAPL) “X”-Day Winning Streak
See what’s driving market performance around the world in today’s Morning Lineup. Bespoke’s Morning Lineup is the best way to start your trading day. Read it now by starting a two-week trial to Bespoke Premium. CLICK HERE to learn more and start your trial.
“Price is rarely the most important thing.” – Tim Cook
When our alarms went off this morning, futures were indicating a mixed to positive open, but that tone has moved firmly to the side of gains following reports of progress being made in the Russia-Ukraine ceasefire talks. The Ukrainian side believes that enough progress has been made to warrant a meeting between Putin and Zelenskyy, while the Russian side has said that talks have become constructive. We’ve seen positive headlines like this in the past only to get walked back in the hours following, but given the heavy losses Russian troops have sustained, there is a stronger feeling that Russia has become increasingly eager for a way out of the war. However things ultimately play out, the market has responded with equities moving higher, and both gold and oil dropping.
Read today’s Morning Lineup for a recap of all the major market news and events from around the world, including the latest US and international COVID trends.
Price may rarely be the most important thing, but shares of Apple (AAPL) are in the middle of an impressive winning streak with ten straight days of gains. Since the launch of the iPod in late 2001, the current streak ranks as just the fourth time that AAPL’s stock has rallied for ten or more days, and it’s the first such streak since July 2010. Of the three prior double-digit winning streaks, the only one that lasted more than ten days was back in 2003.

The chart below shows the performance of AAPL since the start of 2002, and we have included red dots to show each prior time that AAPL was up for ten or more days. Looking at where the prior streaks occurred relative to AAPL’s price trend, one occurred early in an uptrend, one was followed by a short-term pullback, and the other was right in the middle of an uptrend. So, while the winning streak for AAPL is great for shareholders, it appears to say little about the future performance of AAPL’s stock. One item we found interesting, though, is that even after the current ten-day run of gains, the current streak is the first of the four that AAPL’s trailing three-month performance was negative (-2.1%). On the 10th straight day of gains in the prior streaks, AAPL’s trailing three-month returns were 29.3% (2003), 48.8% (2004), and 27.3% (2010).

Start a two-week trial to Bespoke Premium to read today’s full Morning Lineup.
Not All Yield Curve Inversions Are Created Equally
While the Fed has pivoted from a period of quantitative easing to tightening, there has been near devastation in the bond markets as yields rocket higher. Interestingly, short-term rates have risen at a faster pace than long-term rates, which has caused fears of an inversion to resurface. Overnight, for the first time since February 2006, the 5 year yield was higher than the 30 year, which implies that investors have a higher required rate of return for near-term debt instruments (likely due to inflation and real yields). Inversions of yield curves are commonly cited as a leading recession indicator, so investors are carefully watching the movements in yield spreads.
As shown in the chart below, overnight Sunday into Monday morning, there was a brief inversion between the yields of the 5 and 30-year US Treasuries. By late in the afternoon Monday, though, the spread was back to a just barely positive and still narrow 1.3 basis points (bps). Since the start of 1980, the average spread has been 87.4 bps, and since 2000, the average has been even steeper at 126.5 bps.

Below is a long-term chart of the yield spread between 30 year and 5 year US notes. As you can see, the narrowing of the spread has been constant since mid-2021, which is when CPI prints began to come in way ahead of estimates, implying that the Fed would have to take tightening action to slow down economic growth. The last time these yields came close to inverting was in mid-2018, but a pullback in rates caused the spread to widen before an inversion occurred. Looking back historically, while a recession has usually followed an inversion of the 5s30s yield curve going back to 1980, it has not been the most reliable predictor of recessions compared to other parts of the curve. As shown in the chart, there were two different points in the 1980s where the curve inversion was a false alarm, and then again in the mid-1990s, this part of the curve briefly inverted but no recession was forthcoming. Click here to try out Bespoke’s premium research service.
