Meta (FB) Intraday Performance Following Strong Earnings
Yesterday, Meta Platforms (FB) reported earnings. In the report, the company noted a sequential rise in both daily and monthly active users in every region apart from Europe, which can be attributed to the effects of the war in Ukraine. This gave investors a sigh of relief, sending shares up over 14% in premarket trading.
FB has gapped higher by 5%+ in reaction to earnings fourteen times since its IPO. Historically, when this occurs, the stock’s performance from the open and close has been modestly positive, booking gains 57% of the time. The average performance was a gain of 64 basis points (median: 80 bps). The worst intraday performance came in 2014 when the stock traded down by 2.0% percentage points intraday after gapping up 16.05%. On the other hand, the best intraday performance in these time periods occurred in 2018, when the stock gained 4.5% after gapping up 6.0% at the open.
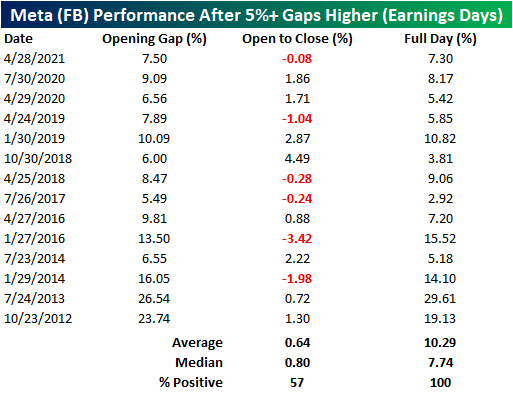
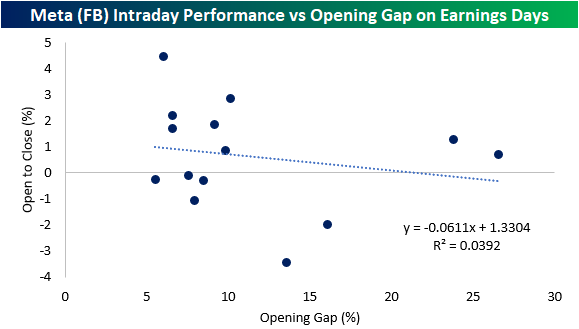
Today marks the fourth-best opening gap since FB went public. This is particularly interesting, as the y/y revenue growth rate in this quarter was the slowest seen since the company went public in 2012. Notably, the opening gap does not seem to be a determining factor for the opening to close performance. As you can see from the chart below, only 3.9% of the variation in the open to close performance can be explained by the size of the opening gap (for 5%+ opening gap gains on earnings). Click here to view Bespoke’s premium membership options.
Bespoke’s Morning Lineup – 4/27/22 – Happy Birthday Universe!
See what’s driving market performance around the world in today’s Morning Lineup. Bespoke’s Morning Lineup is the best way to start your trading day. Read it now by starting a two-week trial to Bespoke Premium. CLICK HERE to learn more and start your trial.
Bespoke’s Quote of the Day: “I much prefer the sharpest criticism of a single intelligent man to the thoughtless approval of the masses.” – Johannes Kepler

Below is a snippet of content from today’s Morning Lineup for Bespoke Premium members. Start a two-week trial to Bespoke Premium now to access the full report.
6,999 years ago today, the Universe was born. At least that’s according to German astronomer Johannes Kepler who came to that conclusion in the 1600s. Kepler’s work has been ‘revised’ in the centuries since, and it is now widely agreed that he was off by at least 10 billion years. What’s a few billion amongst friends, though? It just goes to show that facts that people take for granted in one environment can look foolish in another.
Futures are looking to recoup some of yesterday’s losses, but even at their best levels earlier this morning, we weren’t even on pace to recoup half of Tuesday’s losses. Let’s just call it the ‘two steps backward, one step forward market’. There’s been a ton of earnings news since the close yesterday, and the pace will only intensify over the next two days.
The only two economic reports on the economic calendar this morning are Wholesale Inventories which came in higher than expected (2.3% vs 1.5%), and at 10 AM we’ll get the latest read on Pending Home Sales which are expected to show a decline of 1.0%
In today’s Morning Lineup, we recap overnight events in Asia and Europe (pg 4), take a look at the rising levels of volatility in the Nasdaq 100 (pg 4), and then highlight the dollar’s rip higher in recent weeks (pg 5).
While equities are looking to gain today, the Nasdaq has declined 8.3% over just the last five trading days. Relative to history, this move hasn’t been extraordinary by any means, but it still hurts. Looking more recently at just the period since COVID first surfaced in early 2020, there have only been three other periods where the Nasdaq saw steeper declines in a five-day period.
The first two were during the COVID crash while the third occurred in September 2020 right when the Nasdaq experienced a short-term peak. What’s interesting to note about the current period is that ever since the start of 2022, we’ve started to see the intensity of five-day sell-offs start to increase.

Start a two-week trial to Bespoke Premium to read today’s full Morning Lineup.
Shipments Saving Richmond
The Richmond Fed’s manufacturing survey was released this morning showing a modest improvement in conditions in the month of April. The headline number rose by a point to 14 which is still in the middle of the pandemic range of readings and the highest level since December.

In spite of the improvement in the composite index—a weighted average of shipments, new orders, and employment—the breadth of this month’s report was negative with over half of the categories declining month over month. Two of those declining categories were new orders and employment which are again inputs for the composite. That means the higher reading of the composite was entirely thanks to the 8-point increase in shipments.
Looking across other areas of the report, expenditures were weaker while inventories are recovering from historic lows. While business conditions are mixed to deteriorating, supply chains are showing signs of improvement as evidenced by the increase in shipments.
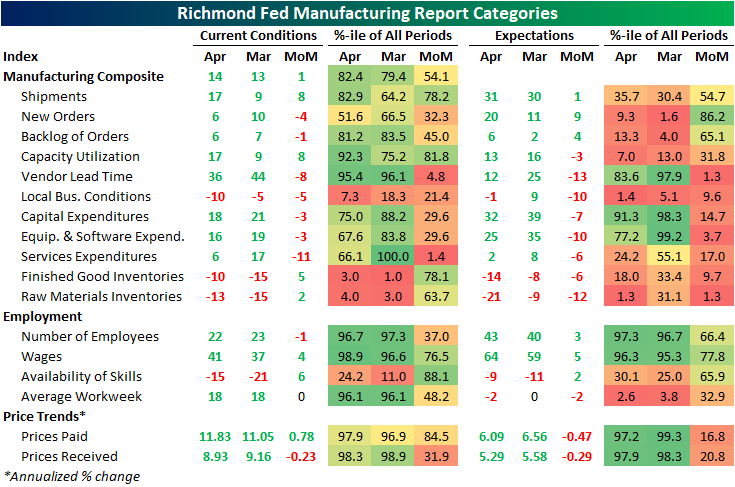
While shipments were an area of strength, another input to the composite, new orders, fell 4 points and is back near the middle of its historical range. Expectations, however, experienced a sizeable rebound with that index rising 9 points. While that increase bucks the trend of weak expectations readings relative to current conditions that we have seen in other regional Fed surveys (which we discussed in last night’s Closer), this index’s increase was the exception rather than the rule. As shown in the table above, only a handful of other expectations categories rose month over month with many declines ranking in the bottom decile of monthly moves.
The big increase to shipments left that index at the highest level since last July as backlog of orders are growing at a substantially more modest pace compared to earlier in the pandemic. One likely reason that both of these readings are improving is a coincident improvement in supply chain stress. The index for lead times saw an 8-point decline ranking in the bottom 5% of all monthly moves. That leaves the index one point above the December low of 35.

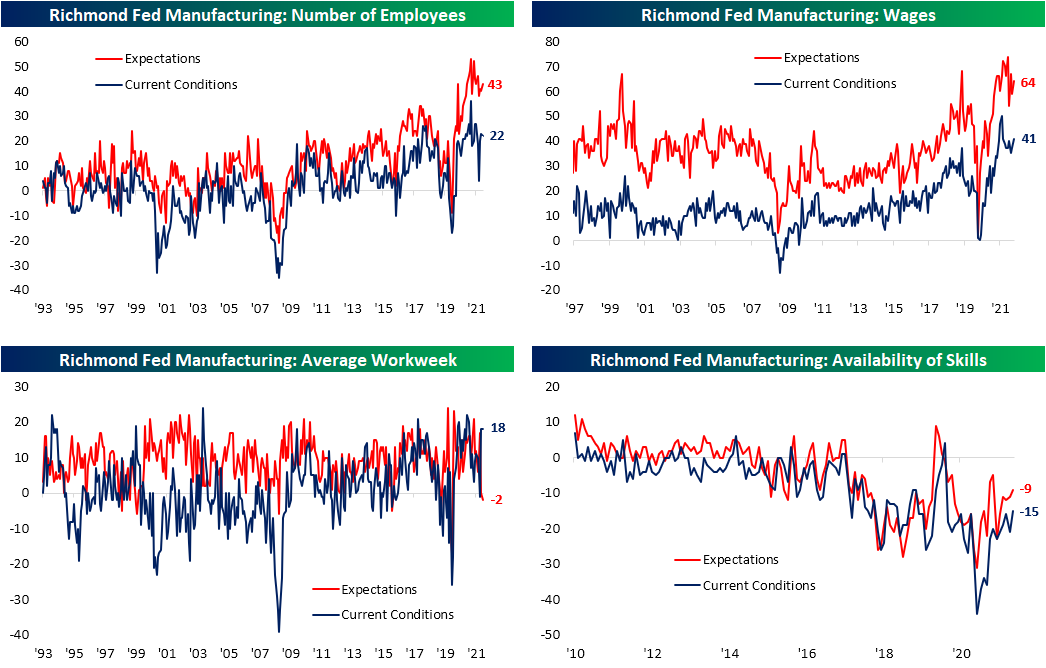
Employment metrics were mixed this month. The region’s firms are still hiring on a net basis, but hiring has peaked and declined again in April. That was in spite of firms also reporting better availability of workers with in-demand skills as that index rose to the highest level since July 2020. With that being said, the negative number indicates a still insufficient supply of quality talent. Wages, meanwhile, saw one of the larger increases in recent months rising to the highest level since September. The average workweek was unchanged at a healthy level in the top 5% of its historical range, but expectations are calling for declines in hours worked on the horizon. Click here to learn more about Bespoke’s premium stock market research service.
Bespoke’s Morning Lineup – 4/26/22 – Big Tech Steps Up to the Plate
See what’s driving market performance around the world in today’s Morning Lineup. Bespoke’s Morning Lineup is the best way to start your trading day. Read it now by starting a two-week trial to Bespoke Premium. CLICK HERE to learn more and start your trial.
Bespoke’s Quote of the Day: “Good ideas are always crazy until they’re not” – Larry Page
Below is a snippet of content from today’s Morning Lineup for Bespoke Premium members. Start a two-week trial to Bespoke Premium now to access the full report.
Yesterday’s reversal was a welcome reprieve for bulls, especially after the straight line lower from early last Thursday. From a technical perspective, there’s not much positive to say about the charts of the S&P 500 and the Nasdaq, but to provide an optimistic scenario, we would note that both indices appear to be showing some signs of a reverse head and shoulders. It’s going to take a lot more upside to make these formations look more convincing, and the pattern for the Nasdaq is much looser than the pattern for the S&P 500, but we thought it was worth highlighting.


While the two largest US indices may, and we stress the word may, be showing early signs of a positive pattern, the semiconductors, which typically act as a leading indicator actually opened at their lowest level since Last May on Monday morning. That being said, like the broader market, the SOX did manage to turn things around finishing the day higher by just over 1.75% and outperforming the S&P 500 and the Nasdaq in the process.

Start a two-week trial to Bespoke Premium to read today’s full Morning Lineup.
Mountains of Earnings
As shown in the snapshot of our Earnings Explorer below, the next two weeks will be the busiest parts of earnings season before things quiet down headed into May. While there will be many more from names not in the index, by next Friday, there will be a total of 917 S&P 1500 companies reporting results with next Thursday the single busiest single day as 184 companies report.

It’s not only a busy week of earnings in terms of the number of companies reporting, but also the size of those companies. In today’s Chart of the Day, we highlighted how this week will see some of the largest companies in the world releasing results all in the same week for just the eighth time on record. As shown below, even though next week will have a higher number of companies reporting, the combined market caps of the companies releasing quarterly results this week far outsize next week. Of course, that is largely thanks to mega-caps. For example, tomorrow there will be over $4 trillion in market cap reporting between three names alone: Visa (V), Alphabet (GOOG), and Microsoft (MSFT). Wednesday will see the half-trillion dollar Meta Platforms (FB) report followed by the biggest day of earnings by market cap on Thursday, totaling nearly $8 trillion. Again, two names alone are a huge share: Amazon (AMZN) and Apple (AAPL). Click here to view Bespoke’s premium membership options.

Dallas Down About the Future
It was another weaker than expected regional manufacturing report this morning as the Dallas Fed’s survey came in at 1.8. The index was expected to decline, but to a more modest reading of 3.5 from last month’s level of 8.7. With expectations declining hand in hand, this report indicates southern manufacturers have seen a significant deceleration in growth and also expect that to continue in the future as the indices for current and future conditions are around the weakest of the pandemic.

Current condition indices out of Dallas more closely resembled the results of the Philly Fed survey last week with weak breadth and readings falling into the middle of their historical ranges. However, like both the Philly and Empire Fed readings, expectations are deteriorating much more quickly than current conditions. As shown below, while many current condition indices are at worst in the middle of their historic ranges, some expectations indices have fallen into the bottom decile of readings after historically large declines month over month in April. For example, the decline in expectations for New Orders ranks in the bottom 1% of all month-over-month moves.
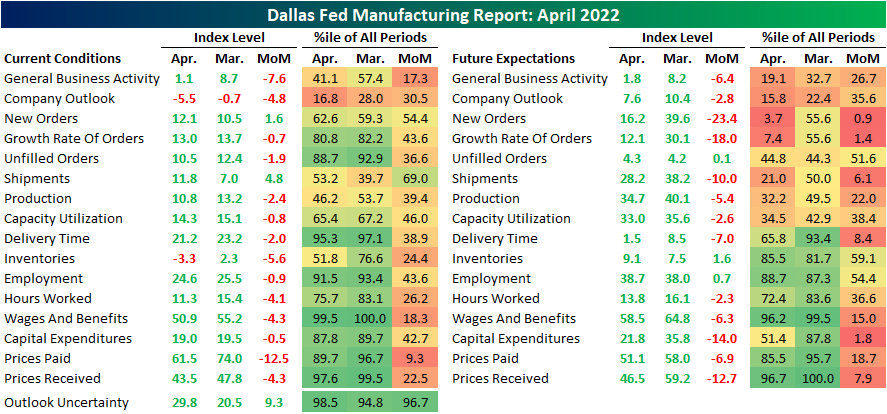
Two indices for current conditions were in contraction in April. The first was inventories while the other, and more negative, was company outlook. This index is now at its lowest level since the historic lows set in the spring of 2020. While still positive, the same can be said for expectations as they have breached new lows as well. That means on net more reporting firms are seeing economic conditions deteriorating than improving.

At the moment, demand has held up with the index for New Orders ticking up slightly though it is well below levels set earlier in the pandemic. As such, Unfilled Orders are still growing but at a slower rate as Shipments saw a modest increase off of post-pandemic lows. Again, in spite of any improvements reported in current conditions, Texas manufacturers do not expect much good to come on the horizon. The monthly declines in expectations for New Orders and New Order Growth Rate rank in the bottom 1% and 2%, respectively, of all monthly changes. While it was not as large of a drop, shipments similarly experienced a sharp decline ranking in the bottom few percentiles.

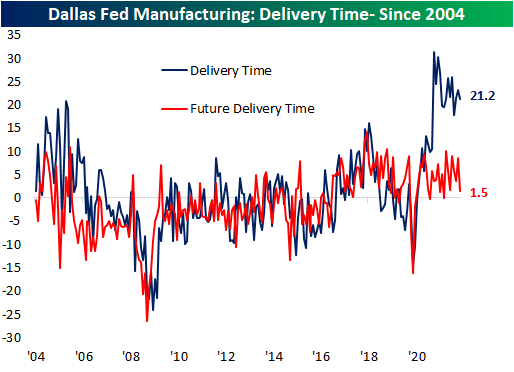
As for one silver lining of the report, there was further evidence of easing of supply chain stress with the Delivery Time index falling to 21.2. This index has been consistently falling over the past year. Expectations saw a coincident decline.
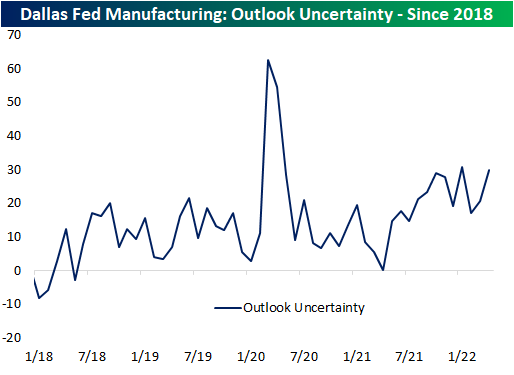
The Dallas Fed also includes in the report an index on uncertainty; a newer index only dating back to 2018 tracking the change versus the prior month in the firm’s uncertainty about company outlook. This index has returned to the upper end of its range near 30. That is slightly below the January reading for the highest levels in the series’ history outside of the beginning of the pandemic.
Be sure to check out tonight’s Closer which will provide an update of our Five Fed Manufacturing Composite, which combines these Dallas Fed readings with those of the Empire and Philly Fed surveys to gauge overall national manufacturer activity. Click here to view Bespoke’s premium membership options.
Bespoke’s Morning Lineup – 4/25/22 – Picking Up Where Last Week Left Off
See what’s driving market performance around the world in today’s Morning Lineup. Bespoke’s Morning Lineup is the best way to start your trading day. Read it now by starting a two-week trial to Bespoke Premium. CLICK HERE to learn more and start your trial.
Bespoke’s Quote of the Day: “Thus fear of danger is ten thousand times more terrifying than danger itself.” – Daniel Defoe, Robinson Crusoe
Below is a snippet of content from today’s Morning Lineup for Bespoke Premium members. Start a two-week trial to Bespoke Premium now to access the full report.
Last week was a brutal one for US stocks as the Nasdaq, Russell 2000, and the S&P 500 fell at least 2.5%. Sector performance within the S&P 500 was also mostly lower but varied widely. Both Real Estate and Consumer Staples managed to finish the week higher, but every other sector was down at least 1% and in many cases a lot more. Thanks in large part to Netflix (NFLX), the Communication Services sector was down nearly 8%, while Energy, Materials, and Health Care all fell more than 3%. Despite the carnage last week, though, only three sectors head into the new week at oversold levels, and two are actually overbought.
What’s also interesting about last week’s declines was that the selling wasn’t confined to either just the year’s winners or losers. The two worst performing sectors are also the worst performing (Communication Services) and the best performing (Energy) year to date. In other words, there wasn’t a whole lot of rhyme or reason behind the weakness.

Start a two-week trial to Bespoke Premium to read today’s full Morning Lineup.
Bespoke Brunch Reads: 4/24/22
Welcome to Bespoke Brunch Reads — a linkfest of the favorite things we read over the past week. The links are mostly market related, but there are some other interesting subjects covered as well. We hope you enjoy the food for thought as a supplement to the research we provide you during the week.
While you’re here, join Bespoke Premium with a 30-day free trial!
Things That Make You Say “Hmm”
Elon Musk says Tesla’s humanoid Optimus robot ‘will be worth more than the car business’ by Nicolas Vega (CNBC)
A yet-to-be released humanoid is expected to surpass the car business eventually as Tesla CEO Elon Musk promises “will become apparent in the coming years”. For our part, we’re just waiting on the self-driving taxis Musk had promised would be ubiquitous by 2022 and have yet to hit the road (or even get close to it). [Link]
Man who paid $2.9m for NFT of Jack Dorsey’s first tweet set to lose almost $2.9m (Guardian/Reuters)
An NFT of former Twitter CEO Jack Dorsey’s first tweet is basically worthless after an initial purchase price of nearly $3mm, surprising precisely nobody. [Link]
Renewables
California ran on nearly 100% clean energy this month by Mark Dediak (The Mercury News/Bloomberg)
On Sunday, April 3rd, California’s electrical grid was 97% powered by renewables, a new record and a glimpse of what the carbon-free power production future (targeted within 25 years) may look like. [Link]
Visualizing All Electric Car Models Available in the U.S. by Omri Wallach (Visual Capitalist)
Ranging from the fully-loaded (GMC’s Hummer EV) to the humble (Nissan’s LEAF), EVs are rapidly rolling out at dealerships and from new entrants across the country. [Link]
Stabilization of gamma sulfur at room temperature to enable the use of carbonate electrolyte in Li-S batteries by Rahul Pai, Arvinder Singh, Maureen S. Tang, and Vibha Kalra (Nature)
A new approach using carbon nanofibers offers one example of the rapid R&D efforts underway throughout the battery supply chain. [Link; 11 page PDF]
Being Perceived
EU Tech Chief Goes Phoneless in Crucial Meetings to Thwart Spies by Stephanie Bodoni (Bloomberg)
Smartphones are generally plenty secure for day-to-day users, but some policymakers are doing away with them on the way in to meetings to avoid being surveilled. [Link; soft paywall]
Following Elon Musk’s Attempted Twitter Takeover, Half of Republicans Say They Feel Muzzled on Social Media by Chris Teale (Morning Consult)
In the latest partisan divide, 51% of Republicans believe that Twitter and Facebook do not allow respondents to express themselves freely, compared with 19% of Democrats and 30% of the population as a whole. [Link]
Real Estate
Homeowner Groups Seek to Stop Investors From Buying Houses to Rent by Will Parker and Nicole Friedman (WSJ)
The front line of the battle against corporate ownership of single-family homes is in HOAs across the country where residents are seeking to restrict rentals of properties. [Link; paywall]
The Terminal
The Bloomberg Terminal can’t be terminated by Robin Wigglesworth (FTAV)
A look at the still-dominant Bloomberg Terminal, which despite its high cost and stagnating sales volumes remains the lynchpin of financial markets information sales. [Link; registration required]
Read Bespoke’s most actionable market research by joining Bespoke Premium today! Get started here.
Have a great weekend!
The Bespoke Report — 4/22/22
This week’s Bespoke Report newsletter is now available for members.
Early Thursday morning, investors were feeling pretty good about the trading week. At that point, the S&P 500 was up 1% on the day and about 2.7% week-to-date, and the index had actually just pushed back above its 200-day moving average.
There was nothing we could identify in the news that caused the S&P to peak around 10 AM ET, but from that point through the closing bell on Friday, the index fell 5.3% in basically as straight of a line lower that you can draw.

Fed Chair Powell did, however, make comments in a speech at the IMF mid-day Thursday where he confirmed that a 50 basis point hike was “on the table” for the May meeting. Markets have been pricing high odds for 50 bps hikes for some time now, but Powell’s comments basically cemented them (for now).
The Powell Fed is known for its jawboning and transparency when it comes to the path for rates. The chart below of equities and fixed income in 2022 tells you what these two asset classes currently think of that jawboning:
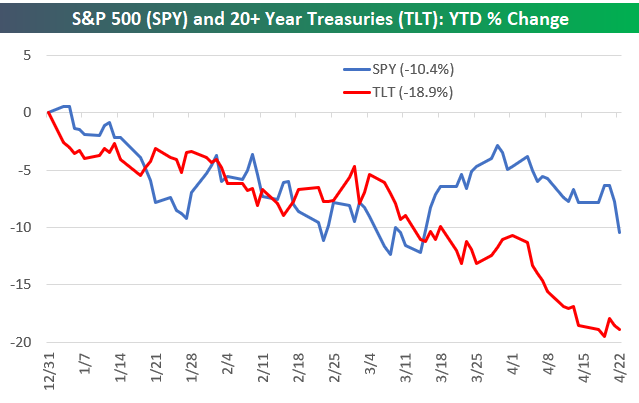
The snippet above is pulled from a page from this week’s Bespoke Report newsletter. If you’re not a Bespoke subscriber and you want to read this week’s full Bespoke Report (and access everything else Bespoke’s research platform has to offer), start a two-week trial to one of our three membership levels.


Bespoke’s Morning Lineup — 4/22/22
See what’s driving market performance around the world in today’s Morning Lineup. Bespoke’s Morning Lineup is the best way to start your trading day. Read it now by starting a two-week trial to Bespoke Premium. CLICK HERE to learn more and start your trial.
Bespoke’s Quote of the Day: “Interest rates are like gravity on valuations. If interest rates are nothing, values can be almost infinite. If interest rates are extremely high, that’s a huge gravitational pull on values.” – Warren Buffett
Below is a snippet of content from today’s Morning Lineup for Bespoke Premium members. Start a two-week trial to Bespoke Premium now to access the full report.
Yesterday’s market sell-off coincided with expectations for an even tighter Fed. As fed fund futures priced in a higher likelihood of tighter policy over the next year, equity prices fell. Below is a chart showing the expected path for the Fed Funds Rate (lower bound) through the March 2023 meeting. Pricing is now suggesting a 50 basis point hike at the May meeting, a 75 basis point hike at the June meeting, and another 50 basis point hike at the July meeting. That would take the Fed Funds Rate up to 2-2.25% (remember, it’s at just 0.25-0.50% now) by mid-July. Talk about a tight summer!
After the estimated 175 basis points of tightening through July, markets are pricing in five more consecutive 25 basis point hikes through March 2023, which would leave the lower bound of the Fed Funds Rate at 3.25%.
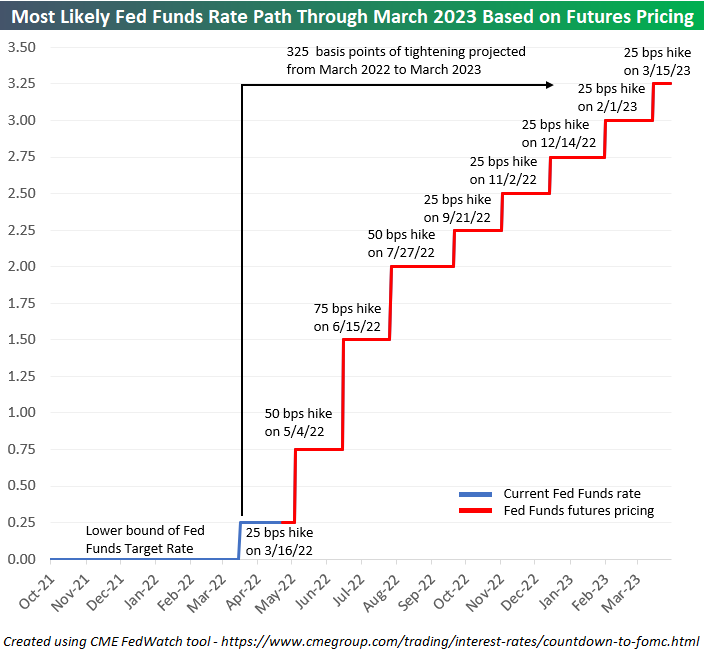
If we do see a Fed Funds Rate of 3.25-3.50% by next March, it will be tied for the steepest one-year of tightening since 1989:

Start a two-week trial to Bespoke Premium to read today’s full Morning Lineup.