The Closer – EV Boom, Credit Spread Collapse, Home Sales Plunge – 7/20/22
Log-in here if you’re a member with access to the Closer.
Looking for deeper insight into markets? In tonight’s Closer sent to Bespoke Institutional clients, we start out with an overview of Tesla (TSLA) earnings as well as the United Airlines (UAL), CSX (CSX), and Las Vegas Sands (LVS) earnings (page 1). We then provide an update on the rapid narrowing of credit spreads (page 2) and the changing dynamics of growth relative to value (page 3). After a recap of today’s historic 20 year bond reopening (page 4), we go over existing home sales (Page 5 and 6) before closing out with an update of the latest EIA stockpile data (page 7).

See today’s full post-market Closer and everything else Bespoke publishes by starting a 14-day trial to Bespoke Institutional today!
Best Performers Since Mid-June Low
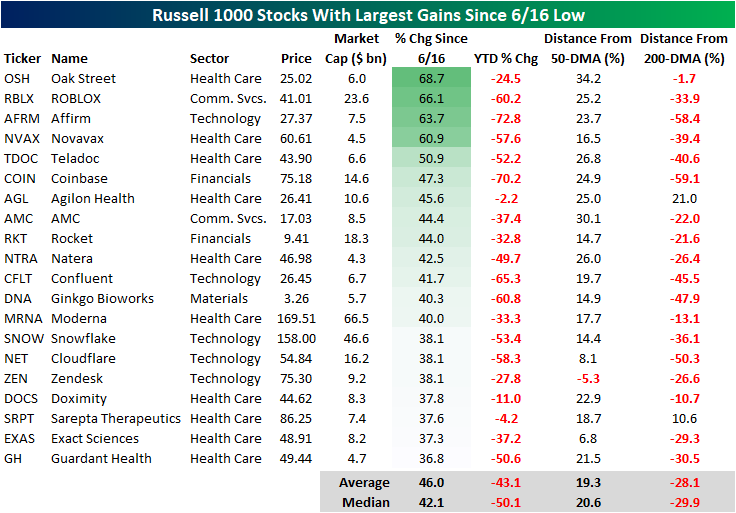
Since June 16th, the market has reversed course higher, making the date at least a near-term bottom. From a technical perspective, the Russell 1000 broke through its 50-day moving average yesterday and broke above its upper downtrend line today. The 50-DMA is still moving lower, but this is the first time that the Russell 1000 has been above the 50-DMA since April 20th. However, the index is still 9.7% below its 200-DMA. These moves come as commodity prices have pulled back and earnings season begins.

As we highlighted in a Chart of the Day earlier this week, the lagging sectors during bear market declines tend to be the leaders in bear market rallies, which is holding true in the bounce since 6/16. The table below shows the 20 best performing stocks in the Russell 1000 Index since the 6/16 low. As you can see, these stocks are all still down considerably on a YTD basis, declining a median of 50.1%. However, these stocks have rebounded by a median of 42.1% since the low on 6/16. Only one of these stocks is below its 50-DMA, and only two are above their respective 200-DMA. If you think that the bear market has concluded, these would be some of the names worth looking deeper into.
On the other hand, the best performing sectors during bear market declines tend to be the worst performing sectors during bear market rallies. Of the 20 worst performing Russell 1000 stocks since 6/16, 14 belong to the energy sector (which has been the best sector on a YTD basis by a wide margin). On a median basis, these 20 stocks are still up 13.6% on a YTD basis, but they’ve shed 13.7% of their value since the market bottomed in mid June. Notably, these stocks (on a median basis) are closer to their 200-DMAs than they are to their 50-DMAs. If you think that we are currently in a bear market rally that is bound to reverse course, these names would be worth looking deeper into.

Declines Abound in Mortgage Data
Roughly one month ago, the national average for a 30 year fixed rate mortgage peaked above 6%. Since then, the rate has pulled back and stabilized around 5.75% in the past several weeks. Although mortgage rates have stabilized a bit, they remain at some of the highest levels since 2008 and have been heading marginally higher in the past week.

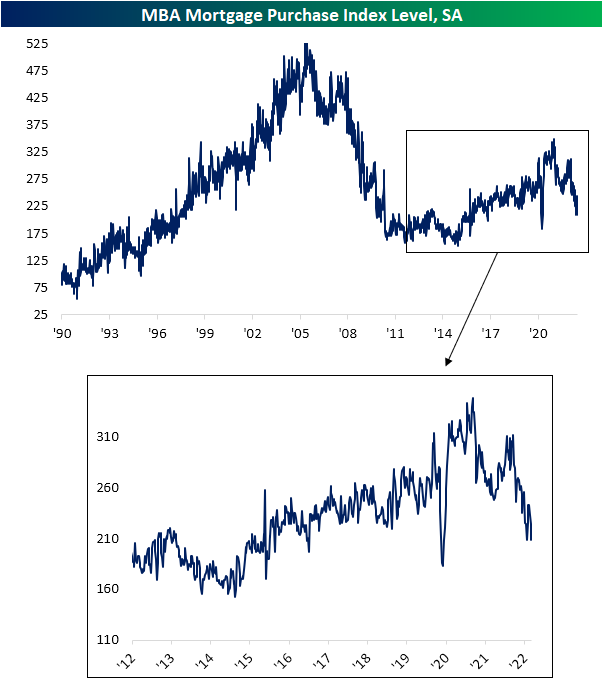
Given the slight rise in rates, demand for mortgages continues to predict further weakness in upcoming home sales data as we noted in today’s Morning Lineup. The MBA’s Mortgage Purchase index released this morning came in at a slightly lower reading than the June 3rd low for the weakest reading in the index since March and April of 2020. This week’s low is also below the range from the few years prior to the pandemic.
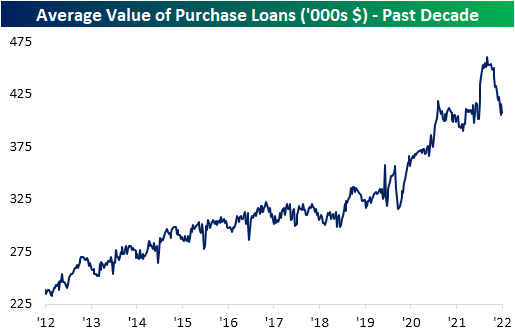
Not only has there been a lower volume of mortgages being applied for, but the actual dollar value of those loans has also plummeted amidst higher rates. As shown below, the average value of purchases reached a high of $460K back in March after a big increase in the first few months of this year. Since then, it has entirely reversed that move with the average value of loans having fallen all the way back down to $406K. That echoes the findings in other recent housing data which has similarly shown declines in home prices.
Higher rates have had an even more significant impact on refinance activity. Following another drop this week, the MBA’s index tracking refinancings has now reached the lowest level since November 2000. Click here to learn more about Bespoke’s premium stock market research service.

Speculators Head for the Hills
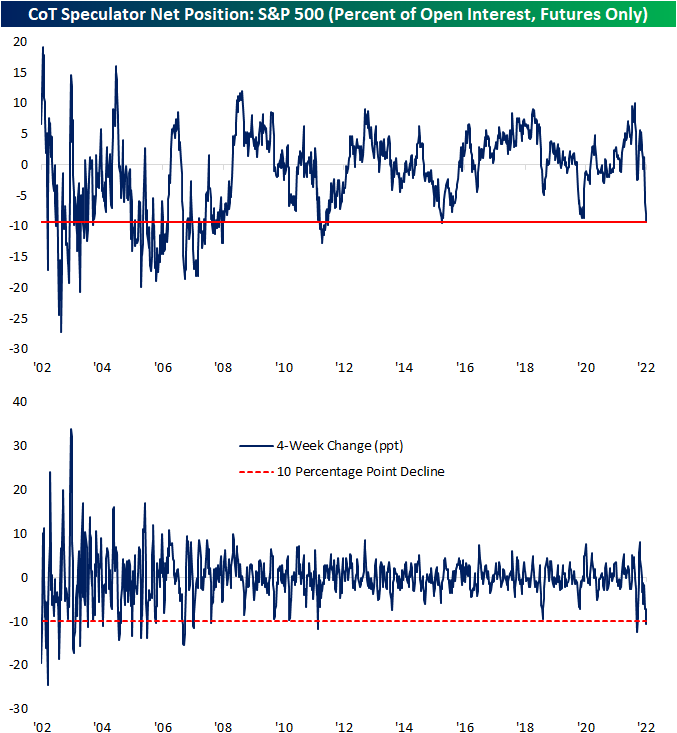
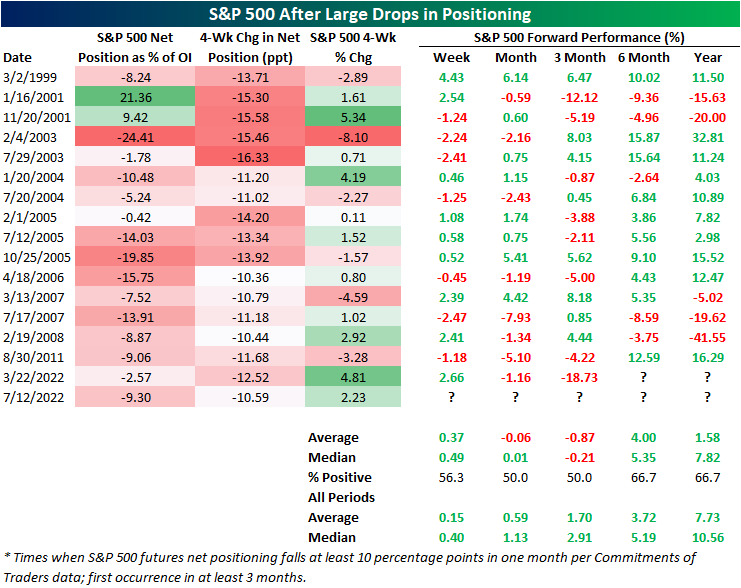
As we do each Monday in our Closer report, we reviewed the latest data from Friday’s release of the CFTC’s Commitments of Traders (CoT) Report. This data shows how speculators are positioned in various assets based on positions in the various futures contracts. One asset that has seen some of the most notable changes of the report in recent weeks has been the S&P 500. As recently as one month ago, that data showed a net 1.29% of open interest was positioned long. Even though the S&P 500 has managed to come off the lows in the past month, positioning has collapsed with a massive move lower meaning there are far more speculators positioned short than long.
Whereas one month ago the reading was net long, in the latest data as of last Tuesday a net 9.3% of open interest was short. That made for the lowest reading since October 2015. In other words, speculators are positioned more pessimistically now than they were during the COVID crash, during the late 2018 near bear market, or any other time over the past several years. The change in positioning has also been rapid. As shown in the second chart below, that net positioning reading has fallen over 10 percentage points in just 4 weeks. Earlier this year in March there was an even larger 12.5 percentage point decline but prior to that, looking back through the history of this data, such large moves have been much rarer over the past decade than was the case in the 2000s and before. In fact, prior to this year the last time positioning in S&P 500 futures fell double digits in four weeks was all the way back in August 2011. On the other hand, the early 2000s frequently saw moves of this size if not larger.
Typically, sentiment data is considered contrarian in nature. In other words, pessimistic sentiment readings are followed by stronger forward performance of equities and vice versa. That has not exactly been the case for this CoT positioning data. Following past declines of at least 10 percentage points, returns have been mixed.
After declines of similar magnitude, the S&P 500 has experienced modest outperformance over the next week. One and three months out, however, have tended to be weaker with postive returns only half the time with negative returns on an average basis. Over the next month, each of the past four instances have been followed by declines.
Six and twelve months out have seen the S&P 500 higher two-thirds of the time, but average and median returns are not significantly better relative to all periods. Click here to learn more about Bespoke’s premium stock market research service.
Goldman and Citi Rip
Following earnings in recent days, both Goldman Sachs (GS) and Citigroup (C) have seen their stocks rip higher, resulting in rarely seen price moves for the stocks. Goldman’s trading segment benefited from increased trading volumes in FX, rate, and commodity markets, helping to fuel a beat on the top and bottom line. C also reported a top and bottom line beat, and every segment saw revenue rise y/y. Click here to view an in-depth analysis of these two earnings reports. Click here to learn more about Bespoke’s premium stock market research service.
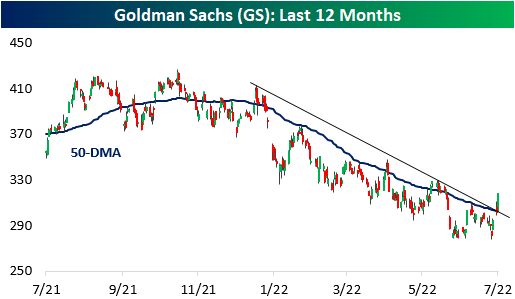
Since the close on July 14th (three trading days ago), GS has ripped 12.5% higher which is the largest three-day rally since May 2020. On its earnings reaction day (7/18), the stock gapped up over four percent but finished the day with a gain of 2.6%. Today, GS jumped an additional 5.5% higher. Notably, the stock has now broken its downtrend and its 50-day moving average, a bullish technical sign for the stock. However, the stock is still down close to 20% on the year, which is worse than the performance of the broader financial sector ETF (XLF).
Following three-day gains of over 12% for GS (for the first time in at least a month), the stock has underperformed its all-period performance on a median basis across each time period we looked at (one day, one week, one month, and three months). Positivity rates are lower as well, so it’s hard to view this occurrence as an overly optimistic signal. One data point to take note of is that the average absolute three-month change is significantly elevated at 20.5% (median: 21.6%). For all periods since its IPO, the average absolute three month price change has been 12.9% (median: 10.1%). If the historical pattern holds, this would suggest that the next three months for the stock will be more volatile than normal. Click here to learn more about Bespoke’s premium stock market research service.

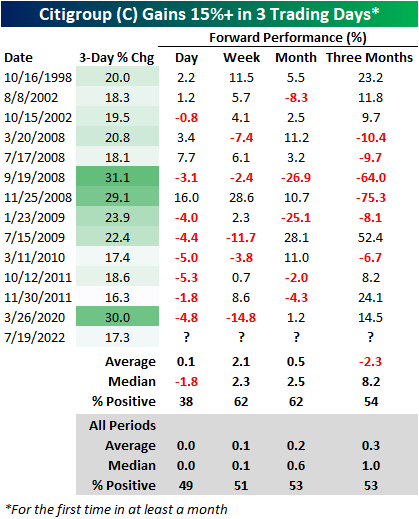
Citi’s chart looks quite similar, and its rally has been even more impressive than the rally in GS as the stock also broke above both the 50-DMA and the downtrend that has been in place since early January. With a gain of 17%, the stock has seen its largest three-day rally since the days coming off the COVID lows in March 2020. Both stocks have also struggled to definitively break through the 50-DMA, so investors should watch these levels carefully over the next few trading sessions. For both stocks, the 50-DMA is still moving lower, but the performance over the last few trading sessions certainly helps the technical picture.

In terms of forward returns, C has had mixed performance following prior three-day gains of at least 17.0%. The table below shows all prior occurrences since the October 1998 merger between Travelers and Citigroup. Of the thirteen prior occurrences, C’s median next-day performance has been a loss of 1.8%, but the stock has booked a median gain of 2.3% over the following week. Over the next three months, C underperforms all periods on an average basis but significantly outperformed on a median basis, and positivity rates have been narrowly above that of all periods. Three months out, C has averaged an absolute move of 24.5% (median: 11.8%), which like GS, is much higher than the 13.2% (median: 9.1%) average absolute three-month change for all periods. Long story short, although the technical picture has improved for both GS and C, investors should continue to expect volatility ahead.
Bitcoin to Ethereum Ratio in Freefall
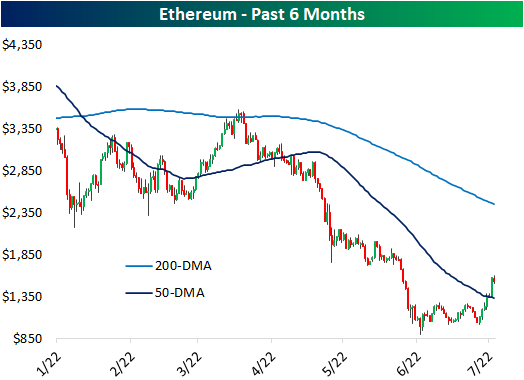
Risk assets have found some stability in the past month, but one asset that has been absolutely flying higher in Ethereum. The past week’s rally has risen to a remarkable 51% for the world’s second largest crypto bringing its market cap up from $126 billion to $187 billion. In that same span, Bitcoin has only gained 15.5%. After those moves, Bitcoin has returned to its 50-DMA while Ethereum has surged through the line.

Given that massive outperformance of Ethereum, the ratio of Bitcoin to Ethereum has collapsed. In fact, the ratio has now fallen for seven days in a row, tying three other streaks (September 2019, February 2020, and April of this year) for the longest streaks of consecutive days of declines.

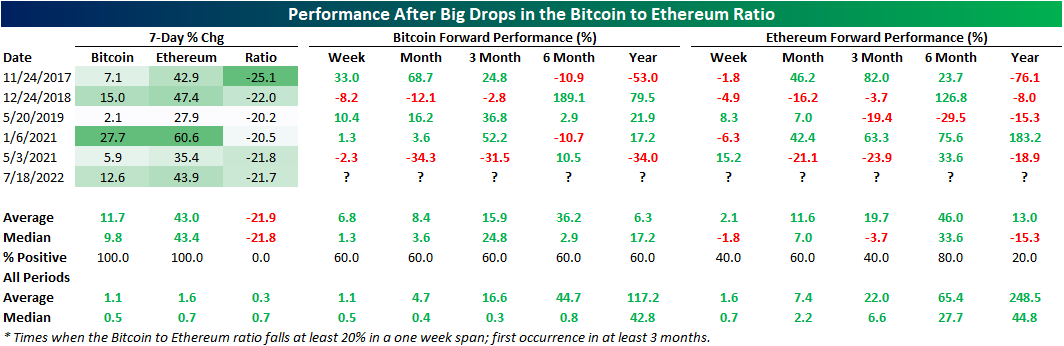
The ratio has fallen considerably as well as consistently in the past week. Exactly one week ago, the ratio hit a near term high and has dropped 23.5% since then. As shown above, that brings the ratio down to the rough uptrend line that has been in place since late last year. Since the start of our price data for Ethereum in November 2017, there have only been a handful of other periods in which this ratio has fallen as sharply; meaning times when there has been similar underperformance of Bitcoin relative to Ethereum. The most recent of these was a little over a year ago in May 2021.

Below we show the performance of Bitcoin and Ethereum during each one of those one week declines of at least 20% in the ratio without another occurrence in the prior three months. This most recent drop in the ratio is only the sixth time such a move has occurred. Performance this time around has been middling relative to these other instances with Ethereum’s 43.9% rally through yesterday when the ratio crossed the 20% decline threshold roughly inline with the median performance of other instances (43.4%). Bitcoin on the other hand has actually been doing a little better with its 12.6% rally larger than the median of 9.8%.
As for where the two largest cryptos head from here, historical performance has been mixed. Overall Bitcoin has more consistently moved higher across the following year. One year out has perhaps been the period with the most dramatic outperformance of Bitcoin. Although it was only higher 60% of the time, Ethereum was only higher one year later once following the January 2021 instance. Click here to learn about Bespoke’s Weekly Crypto Report.
Homebuilder Sentiment Plummets
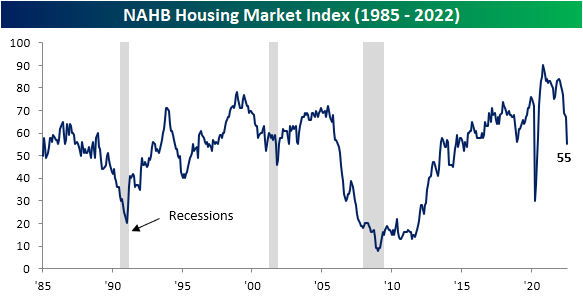
Another bad reading for housing hit the tape today as the NAHB’s Housing Market Index measuring the confidence of US homebuilders experienced its second largest decline on record behind the drop in April 2020. Homebuilder sentiment cratered 12 points month over month sending the index to the lowest level since May 2020 which is also one point below the late 2018 low.
Given the drop in the headline number, each of the individual components (present and future sales and sales traffic) similarly experienced historic declines month over month. Like the headline index, Present Sales and Traffic only experienced larger declines at the start of the pandemic. The same goes for Future Sales, although there was also a slightly larger drop in December 1987 making this month’s drop the third largest on record.

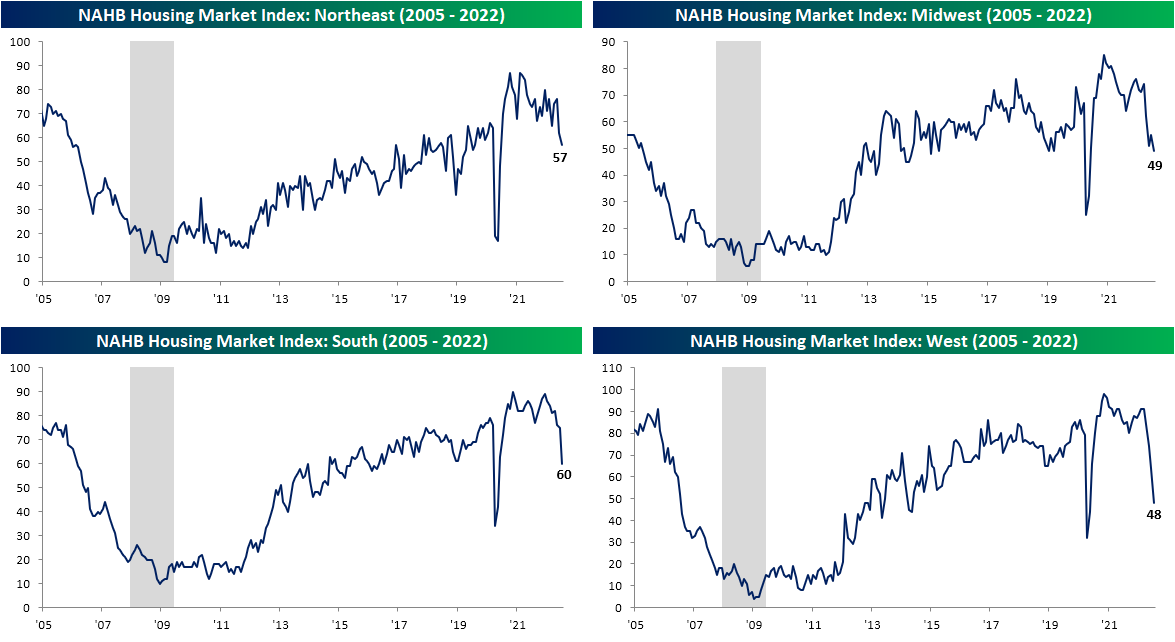
Geographically, no area of the country has been safe from plummeting sentiment, but the Northeast has held up remarkably well. Whereas the South and West saw double digit monthly declines that both were the second largest on record, the Northeast only fell five points to 57. That is a reading just shy of the top quartile of readings unlike the other regions that are in the 52rd percentile at best (South).
The lower sentiment for homebuilders is of course a function of rising mortgage rates and the subsequent dampening demand as a result. As for builder’s roles in existing homes, sentiment is also rolling over. In addition to today’s release, last week saw the quarterly release of the NAHB’s Remodeling Market Index measuring builder’s sentiment regarding remodeling projects. Unlike the Housing Market Index, this index remains historically elevated and down just a bit. In other words, remodeling demand has taken a hit but not to the same extent as projects to build a new home.
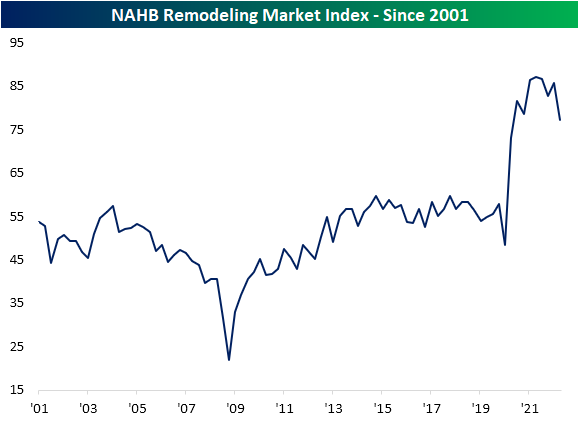
The most pronounced decline in remodeler sentiment has come from the projects carrying the highest costs ($50K or more) even though smaller project outlooks have also been falling for a few quarters now.
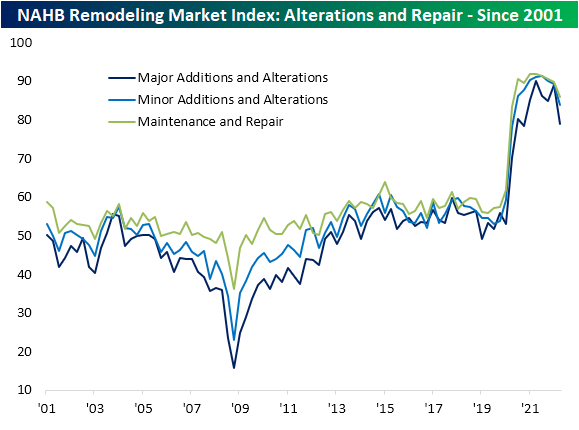
Backlogs have been unwinding as well even if they are historically elevated. A likely big reason for that has been a deceleration in new projects. The index for Appointments for Proposals is much less elevated in the 48th percentile compared to 56th for the headline reading or 68th for Backlog of Remodeling Jobs.

Homebuilder Earnings on Deck
While homebuilder sentiment experienced a historic plunge in the latest reading, homebuilder stocks have actually been on the move higher in today’s session. That brings the total rally off of the June low above 20%, although that is only a dent in the larger decline since late last year. The S&P 1500 Homebuilders group is currently down 31.4% since the December 10th high. Without a coincident drop alongside sentiment, homebuilders continue to hold above their 50-DMA.

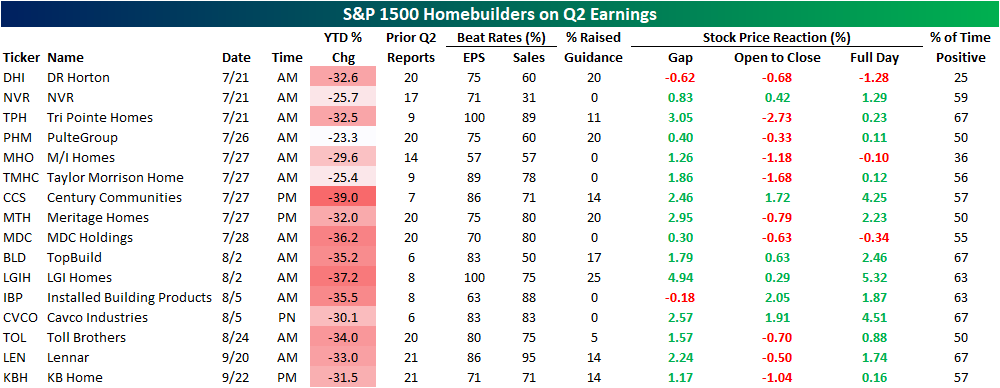
Homebuilders are at a bit of a crossroads at the moment as a further move higher would definitively break the past several months downtrend whereas a break back below its 50-DMA would mark a failed breakout similar to what happened earlier this spring. If today is any indication, macro data hasn’t been a particularly strong catalyst for the industry, however, there is a huge slate of earnings in the month ahead. Later this week on Thursday, DR Horton (DHI), NVR (NVR), and Tri Pointe Homes (TPH) are all scheduled to release quarterly results. Of these, DHI has actually averaged some of the worst performance on Q2 earnings of any homebuilder. The stock has averaged a 1.28% decline on its historical Q2 earnings reaction days and positive returns only a quarter of the time. As for other notables, Q2 has tended to be the best quarter of the year for stock price performance of Century Communities (CCS), Installed Building Products (IBP), LGI Homes (LGIH), and NVR (NVR). Click here to learn more about Bespoke’s premium stock market research service.
Pumped For Some Relief
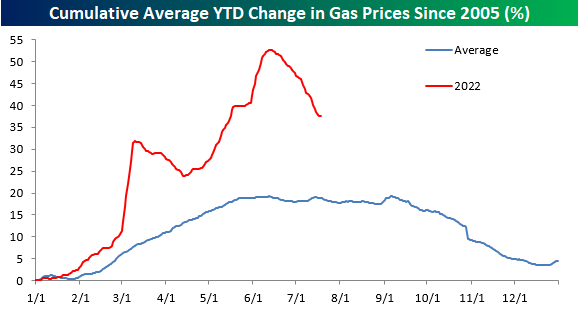
After one of the sharpest YTD surges on record, US consumers have seen a bit of relief at the pump over the last month as gasoline prices, as tracked by AAA, have seen a sharp pullback. The national average price of a gallon of gas currently stands at $4.52, which at any other point in history would have been astronomical, but compared to mid-June when the national average briefly topped $5, current prices seem downright cheap – at least on a relative basis!
The table below shows prices as of 7/18 each year going back to 2005 and where they stood on both a MTD and YTD basis. At $4.52, the national average has never been higher at this time of year, and the only year it was above $4 per gallon on 7/18 was in 2008. On a YTD basis, the average price is still up 37.6%, which is roughly double the average and median YTD gain at this point in the year, but 2021 (40.6%) and 2009 (52.6%) both saw larger YTD increases. One notable aspect of this year so far is that despite the big increases on a YTD basis, this month’s 6.6% MTD decline actually ranks as the largest MTD decline in prices through 7/18.

While the moves this year have been much more extreme than normal, average gasoline prices are following their typical seasonal pattern. Historically, prices tend to peak right around Memorial Day or into early June, and this year’s peak in prices was on June 13th. Granted, this year’s peak (50%+) was much larger than the typical YTD increase leading up to the peak, but the magnitude of the decline in percentage terms has also been steeper than normal. In order to get back down to a more normal YTD pattern, we’re going to need to see continued weakness in prices going forward. But from a seasonal perspective (and barring any hurricanes), there is a tailwind for lower prices. Click here to learn more about Bespoke’s premium stock market research service.
Besides the fact that gas prices hit record levels this year, what has made the period especially painful for consumers is how consistent the increase in prices has been. The chart below shows the y/y change in prices going back to 2005. The current level of 42.71% isn’t necessarily extreme in terms of its magnitude, but what stands out in the chart below is how long the y/y increase has stayed at elevated levels. Back in March 2021, the year-over-year change for gas prices first crossed 30%, and it hasn’t looked back since. When you start lapping 30% y/y increases, it really starts to add up! Let’s hope that this recent dip really starts to have some legs.

Bespoke Brunch Reads: 7/17/22
Welcome to Bespoke Brunch Reads — a linkfest of the favorite things we read over the past week. The links are mostly market related, but there are some other interesting subjects covered as well. We hope you enjoy the food for thought as a supplement to the research we provide you during the week.
While you’re here, join Bespoke Premium with a 30-day free trial!
Labor Markets
Here’s where Tesla’s recently laid-off talent is going by Fred Lambert (electrek)
Workers who have been laid off or otherwise departed Tesla recently has headed to other tech firms, with Rivian, Apple, and Lucid Motors among the biggest recruiters. [Link]
Netherlands Poised to Make Work-From-Home a Legal Right by Lucy Papachristou (WSJ)
Dutch legislation will force employers to consider remote work requests and provide a covered reason denying their request. [Link; paywall]
Food
Learning to Love an Induction Stove by Hannah Goldfield (NYer)
While gas remains a favored cooktop for chefs, home cooks are likely to reduce greenhouse gas emissions, protect their family’s air quality, and reduce cook time. [Link; soft paywall]
Rising prices curb consumers’ taste for chocolate by Maytaal Angel and Jessica DiNapoli (Reuters)
Sweet treats are an easy item to give up for many consumers, especially when high prices for chocolate mean choco-holics are paying out the nose for their fix. [Link]
In Portugal, Taking a Dive Into Sardines by Lily Puckett (NYT)
A look into the very old and very big business of fish canning, an industry dominated by women that is having a moment thanks to foodies’ search for intense and widely available flavors. [Link; soft paywall]
China
Chinese Homebuyers Across 22 Cities Refuse to Pay Mortgages (Bloomberg)
With apartment development timelines dragging out in part due to builders’ financial challenges, owners already on the hook for payments are starting to boycott their loans in protest. [Link; soft paywall]
China Is Stealing Taiwan’s Sand by Elisabeth Braw (FP)
Taiwanese islands close to the mainland regularly see thousands of dredgers and support vehicles trespass with the goal of removing sand for use in a huge range of applications from land reclamation to concrete or glass manufacturing. [Link]
Subscriptions
Instagram now lets creators publish feed posts just for their subscribers by Chris Welch (The Verge)
Content on Instagram can now be pushed exclusively to paid subscribers, following in the steps of Twitter and adding to a similar feature for Stories. [Link]
Netflix Changes Tack With Marketing Spree for $200 Million Film by Lucas Shaw (BNN Bloomberg)
Instead of just letting users discover a new movie, Netflix is actively marketing its new blockbuster (featuring Ryan Gosling) in a bid to re-start subscriber growth and maintain its position within the streaming wars. [Link]
BMW starts selling heated seat subscriptions for $18 a month by James Vincent (The Verge)
The German auto manufacturer is testing a feature that would allow users to pay full freight for heated seats up front or pay less in monthly installments…all to access a feature that comes built into the car but can be turned on or off with software. [Link]
Market Innovation
‘The market is just dead’: Investors steer clear of 20-year Treasuries by Kate Duguid and Colby Smith (FT)
Since being reintroduced in 2020, the 20y Treasury bond has found very little interest from investors as low liquidity and weak real money interest have made it attractive to nobody. [Link; paywall]
Lumber Futures Are Getting a Makeover by Ryan Dezember (WSJ)
In a bid to expand volumes, the CME is reducing the size of its lumber future by 75%, changed the delivery point, and broadened eligible species to allow for more participation on both sides of the contract. [Link; paywall]
Approval
Most Democrats Don’t Want Biden in 2024, New Poll Shows by Shane Goldmacher (NYT)
With President Biden deep underwater in broad polling, a majority of Democrats would prefer someone else in a primary challenge; that said, a failure to renominate a sitting President would be a major shocker in the longer-term history of the US two-party system. [Link; soft paywall]
Too Much of A Good Thing
A new ‘miracle’ weight-loss drug really works — raising huge questions by Hannah Kuchler (FT)
Last year the FDA approved a weight loss drug that led to patients losing 15% of their body weight on average. Its history and approval are controversial: patients will likely need to take it long term at a monthly list price of $1,350. [Link; paywall]
Read Bespoke’s most actionable market research by joining Bespoke Premium today! Get started here.
Have a great weekend!