Bespoke Market Calendar — November 2022
Please click the image below to view our November 2022 market calendar. This calendar includes the S&P 500’s average percentage change and average intraday chart pattern for each trading day during the upcoming month. It also includes market holidays and options expiration dates plus the dates of key economic indicator releases. Click here to view Bespoke’s premium membership options.

Wild Monthly Moves
Talk about a wild year. Check out the monthly moves in the S&P 500 so far this year. You probabably thought it was volatile in Q1 when the S&P 500 had two declines of 5.3% and 3.1% followed by a gain of 3.6%. Q2 saw even bigger swings with two declines of over 8% sandwiched between the month of May when the S&P 500 was up by the smallest amount possible (0.01%). In Q3, the S&P 500 rallied 9.1% in July, but then gave back all of those gains and more in the subsequent two months. Q4 started off on a positive note with a gain of nearly 8%, but there’s still two months left to give back all of those gains as well.

It’s not often that you see moves of such a large magnitude in the S&P 500, especially when they’re to both the downside and upside. Let’s start with the up moves. October was the second month this year that the S&P 500 rallied 7.5% or more, and while that may not sound like much, it is enough to be tied (with several other years) with the most in the post-WWII period. While there were three years with a higher frequency of 7.5%+ monthly gains in the 1930s (1933, 1935, and 1938), the only other years with as many 7.5%+ monthly moves in the post-WWII period were in 1948, 1954, 1982, 2001, 2009, and 2020.

In terms of downside 7.5%+ months, this year has been even more extreme. With three monthly declines of 7.5%+, 2022 is tied with only 1974 and 2008 for the most in any post-WWII year. The only years with more were all in the 1930s (1932, 1933, 1934, and 1938).
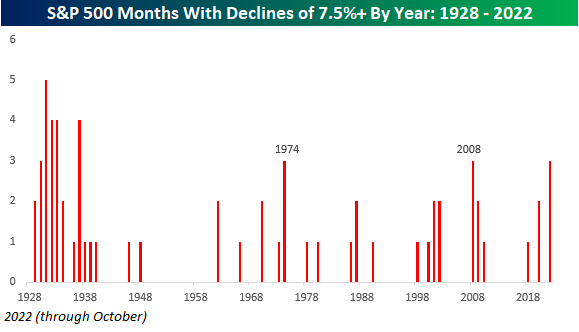
Combining the two series together is where things really start to get interesting. With five monthly moves of at least 7.5% in either direction, there hasn’t been a single year in the post-WWII period with more- and there are still two months left to go. The only years with a higher number of 7.5% monthly moves were 1931, 1932, and 1932. While market-makers (are there any of those anymore) may be loving the volatile trading environment of 2022, most investors probably can’t wait to wipe the slate clean in 2023. Click here to learn more about Bespoke’s premium stock market research service.

Bespoke’s Morning Lineup – 11/1/22 – Even the Yen is Up
See what’s driving market performance around the world in today’s Morning Lineup. Bespoke’s Morning Lineup is the best way to start your trading day. Read it now by starting a two-week trial to Bespoke Premium. CLICK HERE to learn more and start your trial.
“For every moment of triumph, for every instance of beauty, many souls must be trampled.” – Hunter Thompson

Below is a snippet of content from today’s Morning Lineup for Bespoke Premium members. Start a two-week trial to Bespoke Premium now to access the full report.
After the best month for the DJIA since 1976 (and a strong but not nearly as notable month for the S&P 500 and Nasdaq), the markets are looking to kick off November on the same bullish footing as both the S&P 500 and Nasdaq are on pace to open higher by over 1%. It’s not just US stocks that are rallying either. Chinese stocks surged overnight on rumors that the country would relax its COVID restrictions, and the gains followed right into the European markets as major averages on the continent are up over 1% across the board. Bond yields are also lower and commodities are rallying. In fact, just about everything except for the dollar is trading higher this morning. Even the yen is up!
There are three economic reports on the calendar this morning, and they’re all at 10 AM. The JOLTS report is lagged a month (September), but that will be an important indicator to watch to see if there’s any follow-through from last month’s big drop. A decline well below 10 million would be just what the Fed would want to see heading into this week’s meeting. Also at 10 AM, we’ll get September Construction Spending which is expected to fall by 0.6% compared to last month’s decline of 0.7%, and most importantly, the ISM Manufacturing report is expected to decline right to 50.0. Anything below that would indicate a contraction in the manufacturing sector.
Earnings season is barely half over, but already it’s been a memorable one. Think about this for a minute. While Apple (AAPL) managed to buck the trend and rally over 7% in reaction to its earnings report last week, the other mega-caps in the S&P 500 like Alphabet (GOOGL), Amazon.com (AMZN), Microsoft (MSFT), and Tesla (TSLA) all fell 7% or more in reaction to their reports. Additionally, Meta (META), which is no longer a mega-cap because it fell so much, lost a quarter of its market cap in a single day! Despite the pummeling in the S&P 500’s largest stocks, the index is still up over 6% this earnings season. Talk about resilience!
The chart below compares the performance of the S&P 500 at this point in earnings season to the same point (24 calendar days) in each prior earnings season since the start of 2009. The 6.4% rally so far ranks as the best since Q3 2011. Going back to the start of 2009, there have only been two other earnings seasons where the S&P 500 was up more at this point in the reporting period, and there were only a total of five where it was up more than 5%. Now, just because equities have done well this reporting period doesn’t mean it’s off to the races from here (last earnings season the S&P 500 also performed well only to crater from late August through early October), but the market’s ability to rally with no help from its ‘generals’ is impressive.

Our Morning Lineup keeps readers on top of earnings data, economic news, global headlines, and market internals. We’re biased (of course!), but we think it’s the best and most helpful pre-market report in existence!
Start a two-week trial to Bespoke Premium to read today’s full Morning Lineup.
Best October Since…
You’ve likely heard it a number of times in the last several days, but the Dow’s gain of 13.95% this month ranks as the best month for the index since January 1976 and the best October since at least 1900, and it’s not even close. Prior to this October, the DJIA’s best October since 1900 had been a gain of 10.65%.

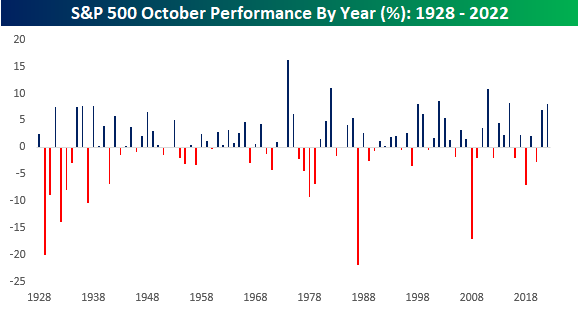
The DJIA may have had its best October in over 120 years, but it wasn’t nearly as momentous of a month for the S&P 500. With its gain of 7.99% this month, the S&P 500 only had its best October since 2015 when the index rallied 8.30%.
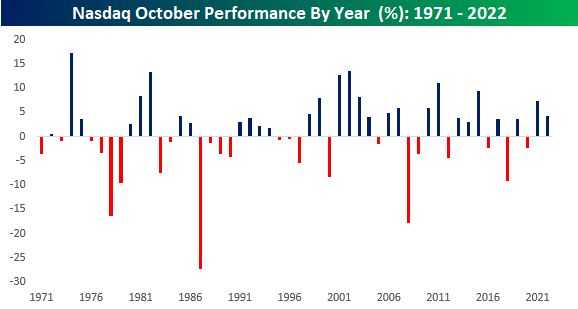
For the Nasdaq, this month’s gain was pedestrian when compared to the Dow or S&P 500. With its gain of 3.90% in October, the Nasdaq’s rally was barely more than half of the rally seen last October (7.30%). While the general trend of major equity indices tends to be highly correlated in the long term, as this month’s returns indicate, shorter-term performance can vary widely. Click here to learn more about Bespoke’s premium stock market research service.
Record Inflow into High Yield (JNK)
High yield bonds proxied by the third largest ETF tracking the space, the SPDR Bloomberg High Yield Bond ETF (JNK), went on a solid 3% run last week. That ranks as the fifth best performing fixed income ETF in our Trend Analyzer. That resulted in the ETF to close above its 50-DMA for the first time since late August. Today, the ETF has reversed those gains and is hovering slightly back below that moving average.

Although from a technical standpoint that could mean Friday’s breakout was a pump fake, the move was backed by near record volumes hence a record single day inflow. As shown below, roughly $980 million went into JNK on Friday, surpassing the previous record of $774 million set this past January. While total assets have been on the downswing for the past couple of years leaving plenty of room to go until the ETF is back up to its size from its peak in the summer of 2020, that single day inflow did put an impressive dent in those recent outflows. Click here to learn more about Bespoke’s premium stock market research service.

Gold Tarnished
The end of October is now here and barring a massive turnaround by the close, gold is on pace to once again end the month lower. Gold peaked back in August of 2020, but since the spring it has taken a more dramatic leg lower. In spite of a high inflationary environment, the often-considered to be go-to inflation hedge has been on a relentless streak of declines. With October’s lower close month to date, gold has now dropped for a record seven months in a row. Going back to 1975, there have been a handful of other streaks lasting for five or six months, but none until now extended out to seven.

Although the current decline has been a record in length, the degree to which gold has fallen during it has not been as severe as some of the prior streaks of 5 months or more. For example, in 1976, 1981, and 1982 gold fell well over 20% compared to the current 16.1% decline. While we do not have a crystal ball to see if gold will end this streak in November, we would note that during the month that snaps these streaks, gold’s performance tends to be particularly strong with an average gain of 5.5% compared to the norm of only a 0.5% rally for all months since 1975. Similarly, gold tends to find itself higher three, six, and twelve months later with stronger than normal performance. Click here to learn more about Bespoke’s premium stock market research service.

Bespoke’s Morning Lineup – 10/31/22 – Giving Some Back
See what’s driving market performance around the world in today’s Morning Lineup. Bespoke’s Morning Lineup is the best way to start your trading day. Read it now by starting a two-week trial to Bespoke Premium. CLICK HERE to learn more and start your trial.
“It’s better to burn out than to fade away.” – Neil Young
Below is a snippet of content from today’s Morning Lineup for Bespoke Premium members. Start a two-week trial to Bespoke Premium now to access the full report.
After an exceptionally strong end to last week, equities are in a bit of a letdown mode to close out October as S&P 500 futures are down about 0.30% with the Nasdaq weaker. A number of weak data points out of China and Europe along with continued geo-political concerns haven’t helped sentiment. The 10-year yield is firmly above 4% again this morning and crude oil prices are nearly 2% lower and back below their 50-DMA. It’s been nice over the last several sessions not to have to contend with the FOMC, but that will all change on Wednesday when they will likely raise rates by 75 bps for an unprecedented fourth straight meeting.
We’ve seen some wild finishes to the trading week lately. Over the last 12 weeks, there has only been one Friday where the S&P 500 didn’t finish up or down at least 1% (9/16), and over the last six weeks, the last trading day of the week has seen a gain or loss of at least 1%. Not only that, but the last trading day of the week has become even more volatile over the last four weeks. Of the four Fridays this October, the S&P 500 has rallied or declined at least 2% each time. The first two Fridays of the month experienced declines of 2.8% and 2.4%, respectively and the last two Fridays have seen gains of 2.4% and 2.5%.
Prior to this month, going back to 1952 when the five-trading day week was established on the New York Stock Exchange, there were only four times when the last trading day of the week had a daily move of +/-2% for three straight weeks, but none of those streaks never extended to four. There’s a first for everything, though, and this month’s streak is the first time in over 70 years that the S&P 500 has ever had four straight 2% gains or losses to end a trading week.

Last Friday’s 2%+ gain for the S&P 500 capped off what was a weekly gain of just under 4% for the S&P 500 in what was a broad rally. Sectors leading the way higher were Industrials, Utilities, Financials, Real Estate, and Consumer Staples which all had gains of over 6%. Health Care and Technology also marginally outperformed the S&P 500 gaining over 4%. On the downside, Communications Services was by itself the to downside as negative reactions to earnings from Alphabet (GOOGL) and Meta (META) weighed on the sector. Lastly, even though they all rallied over 1.5%, Consumer Discretionary, Energy, and Materials all underperformed.

As far as the major indices are concerned, the chart patterns for both the Nasdaq 100 and the S&P 500 look very similar. The key difference between the two is that while the S&P 500 managed to rally back above its 50-DMA last week, the Nasdaq 100, weighed down by weakness in mega-cap stocks and their reactions to earnings, has yet to break above that critical level.

Our Morning Lineup keeps readers on top of earnings data, economic news, global headlines, and market internals. We’re biased (of course!), but we think it’s the best and most helpful pre-market report in existence!
Start a two-week trial to Bespoke Premium to read today’s full Morning Lineup.
Bespoke Brunch Reads: 10/30/22
Welcome to Bespoke Brunch Reads — a linkfest of the favorite things we read over the past week. The links are mostly market related, but there are some other interesting subjects covered as well. We hope you enjoy the food for thought as a supplement to the research we provide you during the week.
While you’re here, join Bespoke Premium with a 30-day trial!
Energy
Halliburton profit tops Wall Street estimates as oil activity booms by Liz Hampton & Shariq Khan (Reuters)
Oil services company Halliburton announced a very strong third quarter this week, with the CEO characterizing demand as “stronger than I have ever seen at this point in the year”. [Link]
U.S.-Saudi Relations Buckle, Driven by Animosity Between Biden and Mohammed bin Salman by Stephen Kalin, Summer Said, and Dion Nissenbaum (WSJ)
Saudi Arabia’s next king has made a habit of mocking the American President, complicating relations between the former top oil producer and the United States. [Link; paywall]
Perks
Citadel, Blue Owl Expand in Connecticut in Bid to Cut Commutes by Natalie Wong, Hema Parmar, and Lizzie Kane (Bloomberg)
Finance firms are offering more office space close to where their employees live in a bid to bring down the time commitment of commuting and getting more people into the office. [Link; soft paywall]
Content
Pinterest, Headspace offer free mental health resources to content creators: ‘We wanted to inspire the people who do the inspiring’ by Renée Onque (CNBC)
Social media companies dependent on popular content creators are starting to lure talent with some perks that might not make much sense to those of us not struggling under the burden of social media fame. [Link]
YouTube’s richest creator MrBeast is seeking a $1.5 billion valuation in what could be a massive milestone for influencer-led business by Alice Hearing (Fortune)
YouTube’s highest-paid creator is trying to sell a stake in his sprawling content and brand empire valued at $1.5bn, in what could be a landmark in finance for this area of entertainment. [Link]
Education
Students Are Using AI to Write Their Papers, Because Of Course They Are by Claire Woodcock (Vice)
With a relatively simple prompt, AI language tools are able to craft essays that fool professors and earn students the easiest of A’s. [Link]
Pandemics
So far, this flu season is more severe than it has been in 13 years by Lena H. Sun (MSN/WaPo)
Almost 900k flu cases and 360 deaths have piled up already this season, with caseloads highest in the US South and Southeast. This is the worst start to a flue season since 2009 so far. [Link]
COVID-19 Origins: Investigating a “Complex and Grave Situation” Inside a Wuhan Lab by Katherine Eban and Jeff Kao (Vanity Fair)
A report issued by the minority staff of the US Senate Committee on Health, Education, Labor, & Pensions released this week argued the COVID-19 pandemic was “more likely than not the result of a research-related incident”. This article investigates that thesis from a non-virological perspective. [Link]
Tech
Amazon readies 172,000-square-foot Kirkland factory to build Kuiper satellites by Alan Boyle (GeekWire)
Amazon is planning to ramp up a global fleet of more than 3,000 satellites that will provide broadband internet. Scaling up production will require a massive Washington facility. [Link]
Intel CEO Calls New U.S. Restrictions on Chip Exports to China Inevitable by Tim Higgins and Asa Fitch (WSJ)
The largest American chip manufacturer viewed a fight over chips as inevitable given the approach that each country has taken to geopolitical conflict and control of high-end semiconductors. [Link; paywall]
Sports
Buffalo Bills unveil first design images of their new $1.4 billion stadium by Jessica Golden (CNBC)
One of the smallest NFL markets will play host to a stadium that will cost taxpayers $850mm. Despite the climate, the final field will remain open to the elements. [Link]
Climate Change
Perfume’s Best Scents Are Being Snuffed Out by Natasha White (Bloomberg)
The feedstock for some of the most iconic scents in the world owe their intensity to the terroir and microclimate of a tiny town in the French Riviera which has been hit hard by drought, raising the specter of a world without Chanel No. 5. [Link; soft paywall]
Read Bespoke’s most actionable market research by joining Bespoke Premium today! Get started here.
Have a great weekend!
Bespoke’s Morning Lineup – 10/28/22 – Stalling Out
See what’s driving market performance around the world in today’s Morning Lineup. Bespoke’s Morning Lineup is the best way to start your trading day. Read it now by starting a two-week trial to Bespoke Premium. CLICK HERE to learn more and start your trial.
“We have never said that we’re perfect. We’ve said that we seek that. But we sometimes fall short.” – Tim Cook
Below is a snippet of content from today’s Morning Lineup for Bespoke Premium members. Start a two-week trial to Bespoke Premium now to access the full report.
We’re seeing another day this morning where Nasdaq futures are much weaker than the broader market. The culprit this morning is Amazon.com (AMZN) which is trading down over 13% after dropping as much as 20% in after-hours trading. The Nasdaq is indicated to open down over 1% while the S&P 500 is down by about half that. Treasury yields are higher this morning, and the 10-year yield briefly traded back above 4% before falling following the latest batch of economic data. Another factor contributing to the weakness in the tech sector is a report that the Biden Administration is considering adding additional restrictions on technology exports to China.
It’s been a busy morning of economic data and the Employment Cost Index (+1.2%), Personal Income (+0.4%), and PCE Prices (+0.3%) were all in line with forecasts. Personal Spending (+0.6%) was higher than expected, and at 10 AM we’ll get Pending Home Sales and Michigan Confidence.
What a month it has been for the Energy sector. Since its recent low in late September, the S&P 500 Energy sector has rallied about 30% and is currently within 4% of its early June high. Looking at a longer-term chart of the sector shows that it has consistently found support at the trendline that extends back to the higher low it made in late 2020. The fact that it managed to bounce at that support during the last leg lower was impressive given that it followed what was a lower high for the sector in late August.

With its gain of over 60% YTD, Energy has trounced the market on a YTD basis, and while the sector has yet to take out its high from June, its performance gap with the S&P 500 did manage to make a new high yesterday as it’s now outperforming the S&P 500 by 80 percentage points YTD.

Our Morning Lineup keeps readers on top of earnings data, economic news, global headlines, and market internals. We’re biased (of course!), but we think it’s the best and most helpful pre-market report in existence!
Start a two-week trial to Bespoke Premium to read today’s full Morning Lineup.
The Bespoke 50 Growth Stocks — 10/27/22
The “Bespoke 50” is a basket of noteworthy growth stocks in the Russell 3,000. To make the list, a stock must have strong earnings growth prospects along with an attractive price chart based on Bespoke’s analysis. The Bespoke 50 is updated weekly on Thursday unless otherwise noted. There were eight changes to the list this week.
The Bespoke 50 is available with a Bespoke Premium subscription or a Bespoke Institutional subscription. You can learn more about our subscription offerings at our Membership Options page, or simply start a two-week trial at our sign-up page.

The Bespoke 50 performance chart shown does not represent actual investment results. The Bespoke 50 is updated weekly on Thursday. Performance is based on equally weighting each of the 50 stocks (2% each) and is calculated using each stock’s opening price as of Friday morning each week. Entry prices and exit prices used for stocks that are added or removed from the Bespoke 50 are based on Friday’s opening price. Any potential commissions, brokerage fees, or dividends are not included in the Bespoke 50 performance calculation, but the performance shown is net of a hypothetical annual advisory fee of 0.85%. Performance tracking for the Bespoke 50 and the Russell 3,000 total return index begins on March 5th, 2012 when the Bespoke 50 was first published. Past performance is not a guarantee of future results. The Bespoke 50 is meant to be an idea generator for investors and not a recommendation to buy or sell any specific securities. It is not personalized advice because it in no way takes into account an investor’s individual needs. As always, investors should conduct their own research when buying or selling individual securities. Click here to read our full disclosure on hypothetical performance tracking. Bespoke representatives or wealth management clients may have positions in securities discussed or mentioned in its published content.