2022 US Stock Market Snapshot
Our Bespoke Report – 2023 Outlook will soon be available for Bespoke subscribers. This report covers everything you need to know about the set-up for financial markets and the economy heading into 2023. If there’s ever a “must-read” Bespoke report, this is it!
You can read our 2023 Outlook by signing up for any of our three membership levels. You can review our membership levels here or simply start a two-week trial to one of them using the links below.
Bespoke Newsletter $49/month – Includes 14-day trial
Bespoke Premium $99/month – Includes 14-day trial
Bespoke Institutional $195/month – Includes 14-day trial

In the introductory section of our annual outlook report, we provide an in-depth breakdown of this year’s market action. Below is a snapshot of the S&P 500’s path throughout 2022. We’ll be expanding further on this chart in the full report, but this is a helpful reminder of how we got to where we are now since trading for the year began on January 3rd
With just ten trading days left in the year, the S&P is down 18.2% year-to-date, which is tracking for the worst year since the Financial Crisis in 2008. As shown below, we’ve seen huge monthly volatility throughout the year within an overall downtrend. If December’s declines hold, we’ll have seen a move of 3% or more in either direction in eleven of twelve months this year. September has (so far) been the worst month with a decline of 9.3%, while July was the best month with a gain of 9.1%. In terms of weekday performance, Mondays, Thursdays, and Fridays have averaged declines this year, while Tuesdays and Wednesdays have averaged small gains.

Continuing Claims Streak Presses On
Economists were expecting this week’s initial jobless claims to show further increases showing an uptick to 232K. Instead, initial claims improved falling to 211K from 231K last week. That 20K decline was the largest decline since the week of July 23rd when it fell by 24K and brings claims to the lowest level since the end of September.

On a non-seasonally adjusted basis, claims fell to 248.88K. That is roughly in line with the levels from the comparable week of recent years (excluding 2020). Historically, claims have consistently fallen in the second week of December with declines around 90% of the time since 1969. As shown in the second chart below, the final couple weeks of the year tend to see that seasonal drop get erased as claims reverse higher into the first weeks of the new year.

Continuing claims have been more in focus lately as the seasonally adjusted number has surged. Once again this week, the count on continuing claims was higher rising to 1.671 million which was just marginally higher than the prior week.

Although it was not a particularly large increase in the latest week, adjusted continuing claims have risen or gone unchanged for nine weeks in a row. Not even during the onset of the pandemic has there been as consistent of a grind higher in continuing claims with 2009 being the last time there was a longer streak. Additionally, as we have noted with various rates of changes in continuing claims, prior long streaks without a decline have only occurred within the bounds of recession.

As with unadjusted initial claims, on a non-seasonally adjusted basis, continuing claims took a small dip as is seasonally normal for this point of the year. As for the weeks ahead, claim counts tend to have choppy seasonality which results in the historical median claims count plateauing a bit before rising into the final weeks of the year. In other words, seasonality is a little bit messy at this point of the year, so we may have to wait until the new year to get readings that are more independent of seasonal factors. Click here to learn more about Bespoke’s premium stock market research service.

Sentiment Snoozer
The data collection period for the survey mostly missed the FOMC’s rate decision and subsequent market reaction, meaning the latest readings are to some degree out of date. Regardless, the latest reading on bullish sentiment from the AAII was little changed once again at 24.3%. That was down modestly from 24.7% last week and 24.5% the week prior.

In the chart below, we show the three-week range that bullish sentiment has moved between. With only 0.4 percentage points between the high and low, the current three-week range has been the smallest on record in data going back to the start of the survey in 1987. Basically, bullish sentiment has been a complete snoozer.

While bullish sentiment has hardly moved, there have been larger shifts in the percentage of respondents reporting as bearish. Bearish sentiment has risen for three weeks straight to reach 44.6%. That is the highest level since November 10th but still handily below the multiple readings above 50% from earlier this year.

Given bearish sentiment climbed by much more than bullish sentiment, the bull-bear spread fell deeper into negative territory. In fact, the record streak of 37 weeks with bears outnumbering bulls presses on.

With bulls little changed, the rise in bears came from those formerly reporting as neutral. Neutral sentiment dropped to 31.1% from 33.5% last week. While that remains an elevated reading relative to most of the past year, it is only slightly below the historical average of 31.4%. Click here to learn more about Bespoke’s premium stock market research service.

Bespoke’s Morning Lineup – 12/15/22 – Data Deluge
See what’s driving market performance around the world in today’s Morning Lineup. Bespoke’s Morning Lineup is the best way to start your trading day. Read it now by starting a two-week trial to Bespoke Premium. CLICK HERE to learn more and start your trial.
“I was now resolved to do everything in my power to defeat the system.” – Oskar Schindler

Below is a snippet of content from today’s Morning Lineup for Bespoke Premium members. Start a two-week trial to Bespoke Premium now to access the full report.
Investors didn’t like what they heard from Powell yesterday, and after sleeping on it overnight, they like what they heard even less. Futures are sharply lower this morning, but it’s not all because of the Fed. Since the close yesterday, we’ve seen a number of other central bank rate decisions around the world, plus a big batch of bad data from China where retail sales, unemployment, industrial production, and property prices all came in weaker than expected. This morning in the US, we’ve also seen a bunch of data, and it has also generally been weaker. Retail Sales, Empire Manufacturing, and Philly Fed all came in weaker than expected, while initial jobless claims were stronger than expected, and continuing claims came in right in line with forecasts.
This morning’s negative tone in the futures is disheartening for investors as it looks like just another failed test of the 200-DMA and the downtrend line that has been in place since the start of the year. Only time will tell if that ends up being the case, but the fact that the Fed continues to push the hawkish narrative right into what is an increasingly large pile of recession signals doesn’t inspire a lot of confidence.
Looking at the chart of the S&P 500, one light of encouragement is the fact that while the S&P 500 completely reversed course and sold off following its two prior tests of the downtrend, in the current one, it has been hanging around right around those levels for a few weeks now. There’s a saying in technical analysis that the more support or resistance is tested, the weaker it becomes, so the fact that we’ve seen multiple tests of the current downtrend with increasing frequency in the last few weeks could be just what the market needs to get through that level. That’s the hope at least!

Our Morning Lineup keeps readers on top of earnings data, economic news, global headlines, and market internals. We’re biased (of course!), but we think it’s the best and most helpful pre-market report in existence!
Start a two-week trial to Bespoke Premium to read today’s full Morning Lineup.
Another Fed Day Ends in the Red
Another Fed day is in the books, and the Fed Funds target rate is now 50 bps higher than it was yesterday. In tonight’s Closer, we will provide further commentary on the content of the FOMC’s statement, SEP, Fed Chair Powell’s presser, and the market reaction. With the S&P 500 finishing the day down 0.61%, today marked the third decline on a Fed day in a row. That is the longest streak of consecutive declines on Fed days since the three meetings ending July of last year. Looking at the price action of the S&P over the past three meetings, today basically stuck to the script. Whereas the index traded higher throughout most of the session leading up to the release of the policy decision, it plummeted when the statement hit the tape. That drop brought the index into the red on the day in a similar way to the September meeting. Declines kept on coming until shortly after Powell took the podium. From there, the S&P 500 rebounded, even pivoting back into the green briefly around the time of the conclusion of the presser. While it did not go on to end the day at the lows of the day like the past couple of meetings, Powell’s presser that pumped stocks back into the green was not long-lasting as the S&P dipped back into the red in the final hour of trading. Click here to learn more about Bespoke’s premium stock market research service.

Energy Losing Its Grip
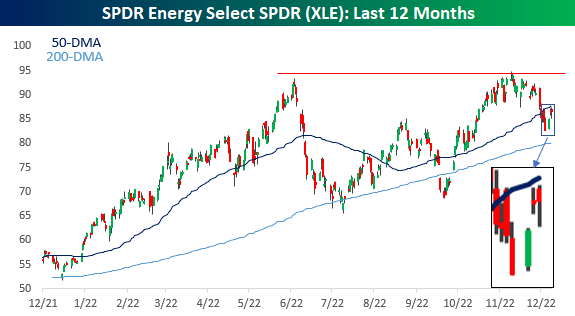
You know those scenes in the movies where a character finds themselves hanging off a bridge, and slowly their sweaty grip starts to loosen as a finger or two starts to slip? That’s what the energy sector is going through right now. As oil prices have been under pressure over the last few months, energy stocks had been holding up relatively well as the S&P 500 Energy sector hit a new cycle high exactly a month ago today. Since then, the sector has declined nearly 9% even as the S&P 500 has moved higher. Last week, the sector broke below its 50-DMA for the first time in over two months before stabilizing this week. Since that break below the 50-DMA on 12/6, the sector has made multiple intraday attempts (including today) to get back above it, but each time the sector has sold off and finished off its intraday highs. When looking at a price chart, any time you see a security break below a key moving average and then make several unsuccessful attempts to get back above that level, it’s often a sign of a momentum shift.
On a relative strength basis, the Energy sector is also toeing a key trendline. The chart below compares the relative strength of XLE to the S&P 500 (SPY) over the last year. During that time, Energy’s relative strength has been riding a trendline higher with bounces each time it kissed that level. The most recent example occurred this week, but at this point, the bounce has been meager. Energy stocks have been outperforming energy commodities in recent months, so it’s only natural to see some mean reversion in the stocks as well, but with the sector already breaking below its 50-DMA, this is a key trendline to watch. If the sector’s relative strength weakens further, the technical picture for the sector would weaken materially, which would be a development investors in just about every other sector wouldn’t shed a tear for. Click here to learn more about Bespoke’s premium stock market research service.

Bespoke’s Morning Lineup – 12/14/22 – Eight is More Than Enough
See what’s driving market performance around the world in today’s Morning Lineup. Bespoke’s Morning Lineup is the best way to start your trading day. Read it now by starting a two-week trial to Bespoke Premium. CLICK HERE to learn more and start your trial.
“Adventure is just bad planning.” – Roald Amundsen
Below is a snippet of content from today’s Morning Lineup for Bespoke Premium members. Start a two-week trial to Bespoke Premium now to access the full report.
Welcome to the 8th and final FOMC policy announcement of the year. Maybe it’s just us, but we would have been fine with just one or two announcements this year and a whole lot fewer speeches. Markets are pricing in a near certainty of a 50 bps rate hike today bringing the Fed’s total interest rate increases for 2022 to 4.25 percentage points. While markets are pretty certain of what the Fed will do, the big question on everyone’s mind is what is Powell going to say.
Isn’t it ironic that in the age of maximum Fed transparency where Fed officials practically speak multiple times a day that investors really have no idea what kind of tone the Fed chair will take at his news conference today? Will he start off the disclaimer that the Fed is “strongly committed to bringing inflation back down to our 2 percent goal”? Hopefully, Powell got up on the right side of the bed this morning and traffic getting to K street wasn’t too bad.
Futures have been mixed all morning on what has been a quiet day for data. The only release on the calendar was Import and Export Prices. Import Prices fell more than expected (-0.6% vs -0.5%), and Export Prices fell less than expected (-0.3% vs -0.5%). At the end of the day, though, none of this matters. Whatever Powell says will dictate the tone of the day. Any hints of a pause or a lowering in the magnitude of rate hikes going forward will be what bulls need to keep the rally going.
Despite recent comments from FOMC officials looking to downplay the significance of inverted yield curves and their impact on the economy, market participants have been intently focused on both the quantity and persistency of inversion at various points on the US Treasury curve. One of the Fed’s preferred measures of the yield curve is the spread between the yields on the 10-year and 3-month US Treasuries. This morning, the 10y3m curve remains inverted by over 80 basis points (bps) which will mark the 15th straight trading day that the curve was inverted by 50 bps or more.
Going back to 1962, there have been four other periods where the 3m10y curve inverted by 50 bps or more for at least 15 straight trading days. Each of those prior streaks lasted much longer than the current streak, although, with the curve inverted by over 80 bps, this streak can also be expected to last much longer. In terms of where these streaks occurred in the business cycle, in each of the four periods, a recession followed within eight months.

Our Morning Lineup keeps readers on top of earnings data, economic news, global headlines, and market internals. We’re biased (of course!), but we think it’s the best and most helpful pre-market report in existence!
Start a two-week trial to Bespoke Premium to read today’s full Morning Lineup.
Inflation Concerns Give Way to Interest Rate Worries
In an earlier post, we detailed the latest NFIB survey of small business optimism. Included in that report are survey results of what small businesses are reporting to be their most important problems to their business. As could be expected with CPI continuing to run in the 7% YoY range, inflation remains top of mind. 32% of respondents to the November survey reported inflation as their biggest concern, slightly outnumbering those reporting cost or quality of labor as the biggest issue. While that continues to be a historically large share of responses, the reading did fall one percentage point month over month as it remains off the peak of 37% in July.

As previously mentioned, behind inflation, the cost or quality of labor (combined) is the next biggest issue for small business, accounting for 30% of responses. That matches the readings from this past July and March for the lowest readings since January 2021. Paired with the other labor related indices of the report, these figures point to some softening of the labor market.

The November report of course coincided with the midterm election. Historically, the NFIB survey has been fairly sensitive to political happenings and the reading on the percentage of respondents reporting government red tape or taxes as their biggest issues has been a good proxy for this. In the past, the reading has tended to be higher during Democrat administrations and lower during Republican administrations. However, during President Biden’s time in office, high inflation has resulted in few respondents seeing political related problems as their biggest issue. That was re-emphasized in November as the reading returned to tie July’s record low of only 16%. We would note that this reading has the potential to turn higher given that past midterm months like 1990, 2002, and 2018 have marked short term spikes lower and higher.

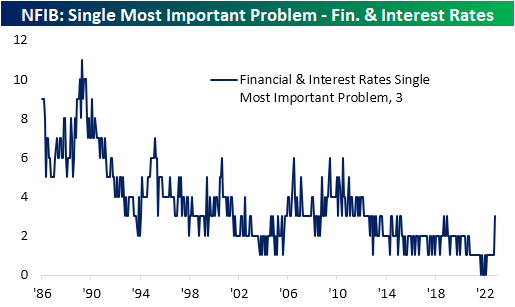
With those biggest issues all seeing a lower share in November, it begs the question of what problems replaced them? Poor sales (+1 ppt), Cost/Availability of Insurance (+2 ppt), Competition from Small Businesses (+2 ppt), and Financial & Interest Rates (+2 ppts) all saw higher readings last month. Of those problems, the latter two are perhaps the most interesting. Historically, neither of these two issues have tended to rank particularly high up among the ten choices given in the survey, but in the past year their share has been decimated without anyone reporting them to be the biggest problems at certain points. That is less so the case today. Competition from big businesses has risen back up to 5% of responses; a reading that would have been similar to much of the first half of the 2010s previously.

Meanwhile, as interest rates have risen rapidly, 3% of responses saw problems with financials and interest rates. Although that is not a large share of total responses, it was the highest share in nearly four years. The NFIB survey is a relatively minor data point and this issue accounts for an overall small share of responses meaning it is highly unlikely this would so much as be considered in regards to monetary policy, however, one potential takeaway of these responses is that small businesses are at least beginning to see some negative impacts of a higher rate environment. Click here to learn more about Bespoke’s premium stock market research service.
Inflation Subsiding For Small Business
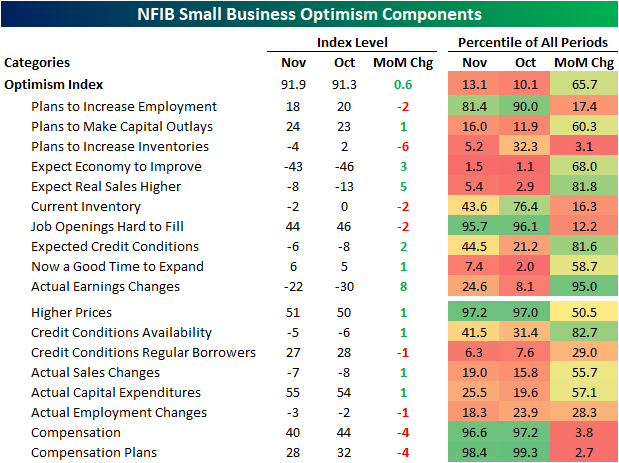
The National Federation of Independent Business (NFIB) released its November read on small business sentiment this morning with the report showing a modest uptick in optimism. The headline index rose from 91.3 to 91.9, but as shown below, that remains at historically low levels.

Across the individual categories of the survey, breadth was mixed with six of the ten inputs to the optimism index moving higher month over month. Multiple sub-indices sit in the bottom decile of their historical ranges, while a handful of others, namely those centered around employment and inflation, are more elevated.
One index that has been well below historical norms has been the outlook for general business conditions (top left chart below). That index plummeted since the fall of 2020 (likely in large part thanks to political sensitivities of this survey), and the rebound over the past few months hasn’t been enough to bring it back up to pre-pandemic record lows. Alongside that rebound, there has been only a very minor jump higher in the share of respondents reporting now as a good time to expand.

As we noted in today’s Morning Lineup, employment metrics in aggregate significantly slowed last month. Hiring plans fell 2 points down to 18; the weakest reading since February 2021. On net, there have also been more firms reporting declines than increases in employment. Given companies appear to be pulling back on hiring, the lowest share reported job openings are hard to fill since April 2021. Not only does it appear that firms are hiring less, but they are also raising compensation less. Both indices for compensation and compensation plans fell sharply in November.

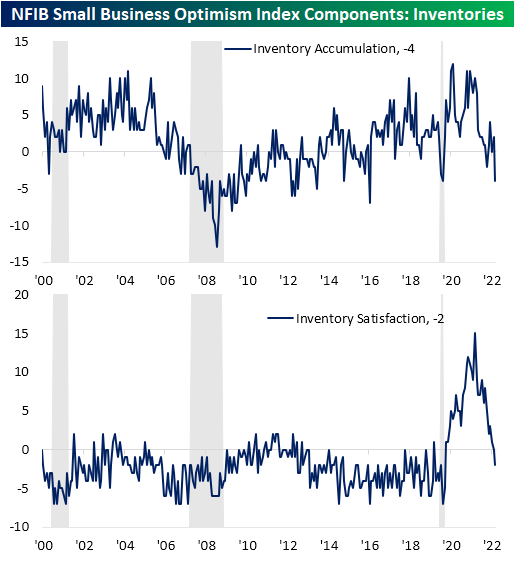
Inventories are yet another area of jarring declines last month. On net 4% more companies reported plans to decrease inventories in the next three to six months making for the lowest reading on inventory accumulation since the depths of the pandemic: April 2020. While there is the potential silver lining that the decline in the reading is a result of improvements in supply chain pressures, it is paired with obvious deterioration in demand. Given this, for the first time since the spring of 2020, a higher share of respondents are reporting their current inventory levels are too high versus too low. Click here to learn more about Bespoke’s premium stock market research service.
Bespoke’s Morning Lineup – 12/13/22 – Most Important Two Days of Month
See what’s driving market performance around the world in today’s Morning Lineup. Bespoke’s Morning Lineup is the best way to start your trading day. Read it now by starting a two-week trial to Bespoke Premium. CLICK HERE to learn more and start your trial.
“It’s a proprietary strategy. I can’t go into it in great detail.” – Bernie Madoff
Below is a snippet of content from today’s Morning Lineup for Bespoke Premium members. Start a two-week trial to Bespoke Premium now to access the full report.
One day short of 14 years after Bernie Madoff surrendered to authorities for his Ponzi scheme, Bahamian authorities arrested Sam Bankman-Fried yesterday in connection with his massive fraud in the cryptocurrency markets. Now that he’s behind bars, we can only hope that the nonstop media tour he has been on will come to an end.
We’ve got two very important days ahead for the markets with today’s November CPI and tomorrow’s FOMC rate decision. Futures are sharply higher heading into this morning’s release after a strong day yesterday, but hopefully, the markets haven’t set the bar too high.
While there is optimism among investors that the worst of inflation is behind us, the sentiment from two sectors that stand to benefit the most from inflation – Energy and Materials – has been mixed. The charts below show the relative strength of the S&P 500 Energy (XLE) and Materials (XLB) sectors versus the S&P 500 over the last ten years (top chart) and just the last year (bottom two charts).
Starting with the long-term picture, after years of underperformance, both Energy and Materials made a trough relative to the S&P 500 in 2020. While they have both stopped the bleeding, the rebound in Energy has been much stronger than the improvement in Materials (which never underperformed as much in the first place).

Over the last year, both sectors have significantly outperformed the market. Starting with Materials, its outperformance peaked in the spring and then came crashing back down to earth in the summer. The sector started outperforming again this fall, but in recent weeks it has started to run out of steam again.

The Energy sector has seen a much steadier trend out of outperformance this year, and its relative strength actually peaked in early November. While the sector has been under pressure relative to the market for the last month now, its relative strength uptrend has remained intact.
In the case of both sectors, their relative strength in recent weeks hasn’t been nearly as strong and steady as it was in the first half of 2022, but they are also far from collapsing reflecting the fact that while inflation pressures have not been as intense as they were earlier in the year, they still haven’t gone away.

Our Morning Lineup keeps readers on top of earnings data, economic news, global headlines, and market internals. We’re biased (of course!), but we think it’s the best and most helpful pre-market report in existence!
Start a two-week trial to Bespoke Premium to read today’s full Morning Lineup.