The Bespoke Triple Play Report — 2/3/23
An earnings triple play is a stock that reports earnings and manages to 1) beat analyst EPS estimates, 2) beat analyst sales estimates, and 3) raise forward guidance. You can read more about “triple plays” at Investopedia.com where they’ve given Bespoke credit for popularizing the term. We like triple plays as an indication that a company’s business is firing on all cylinders, with above-expectations results and an improving outlook. A triple play is indicative of positive “fundamental momentum” instead of pure fundamentals, and there are always plenty of names with both high and low valuations on our quarterly list.
Bespoke’s Triple Play Report highlights companies that have recently reported earnings triple plays, and it features commentary from management on triple-play conference calls, company descriptions and analysis, and price charts. Bespoke’s Triple Play Report is available at the Bespoke Institutional level only. You can sign up for Bespoke Institutional now and receive a 14-day trial to read our newest Conference Call recaps. To sign up, choose either the monthly or annual checkout link below:
Bespoke Institutional – Monthly Payment Plan
Bespoke Institutional – Annual Payment Plan

New Chapter in the Meme Stock Mania
We may be just a little more than a month into the new year, but there have already been a handful of Russell 1,000 stocks that have posted absolutely massive moves. There are currently seven Russell 1,000 stocks that have doubled year to date, some of which are more embattled high-growth stocks like Carvana (CVNA) and Peloton (PTON). Breaking down the index into deciles based on which stocks have the highest levels of short interest clearly shows that the top performers have also been those which have been most heavily bet against by investors. Whereas the decile of stocks with the lowest levels of short interest has risen a mere 4.4%, the decile of most heavily shorted names is up a substantial 36.3%.

Expanding to the Russell 3,000, in the chart below we show an equal weight index of the 100 most highly shorted stocks. Over the past month, the group has rallied almost 30%. That is a comparable rally to this past summer and outside of that, the only larger rallies of the past five years were coming out of the COVID Crash and the early 2021 short squeezes. This is not the first rodeo for highly shorted stocks flying higher. Click here to learn more about Bespoke’s premium stock market research service.

Dollar Down, Internationally Exposed Stocks Up
In last night’s Closer, we provided a decile breakdown of Russell 1,000 stocks’ year to date moves. One area in which there has been a clear distinction between winners and losers has been how exposed the companies are internationally. Given the dollar’s decline this year, stocks which generate a higher share of revenues abroad would face less headwinds from the dollar to make them more attractive and vice versa for stocks that are more domestically focused. That has largely appeared to have played out. As shown below, the decile of stocks that have the least international revenue exposure have only risen an average of 4.5% this year whereas most other deciles have seen average gains in the mid-teens. Then there is the 10th decile of stocks that generate the highest share of revenues abroad. That group is up an average of 22.4% this year.

Again, the dollar’s changes are a key reason for the strength in these stocks with heavy international revenue exposure. As shown below, Bloomberg’s trade-weighted dollar index peaked back in the fall and has been on a one-way trip lower, erasing much of the past year’s gains in the process. Over the past few days, the dollar has rebounded, but the steep downtrend is still alive and internationally focused companies may continue to have some fuel. Click here to learn more about Bespoke’s premium stock market research service.

Hot Jobs
The first employment report of 2023 certainly surprised everybody. While economists were expecting an increase of 188K non-farm payrolls, the actual reading came in at 517K, exceeding expectations by 329K. Going back to 1998, that was the fifth-largest beat relative to expectations and the strongest since last January’s Non-Farm Payrolls report (hence the commentary that seasonal adjustments are a factor in the large beat). While January’s report was ‘only’ the fifth strongest relative to expectations going back to 1998, all of the larger beats have come in the post-pandemic period, so COVID has obviously skewed things and in many cases to a large degree. What we can tell you is that Friday morning’s report was the tenth straight better-than-expected report which is a record and easily surpasses the prior peaks in September 2020 and March 2015.

Looking at the pace of job creation over the last year, the US economy has added 4.967 million jobs in the last twelve months, and while that’s well off the peak from prior readings in the last two years, it still remains extremely elevated relative to history. Prior to COVID, for example, the peak total of job creation over a rolling 12-month period was 3.37 million, or just under 1.6 million below current levels. Click here to learn more about Bespoke’s premium stock market research service.

Bespoke’s Morning Lineup – 2/3/23 – Jobs Day
See what’s driving market performance around the world in today’s Morning Lineup. Bespoke’s Morning Lineup is the best way to start your trading day. Read it now by starting a two-week trial to Bespoke Premium. CLICK HERE to learn more and start your trial.
“The key to a 3-peat is change. You can’t ‘repeat’ the formula. Your opponent has already figured it out.” – Phil Jackson

Below is a snippet of content from today’s Morning Lineup for Bespoke Premium members. Start a two-week trial to Bespoke Premium now to access the full report.
Heading into this morning’s jobs report, market enthusiasm has waned following some lackluster reports from Alphabet (GOOGL), Amazon.com (AMZN), and Apple (AAPL), but it certainly could be worse. Treasury yields are lower while crude oil is basically flat.
This week was billed as the most consequential week of earnings season, and through Thursday at least, the bulls have delivered. After both the S&P 500 and the Nasdaq kicked off the week with declines of more than 1%, they have bounced back over the last three days with gains of over 1% for three straight days. Since the inception of the Nasdaq 100 tracking ETF (QQQ) in March 2009, the current run is only the 12th time that both QQQ and the S&P 500 tracking ETF (SPY) have each been up 1%+ for three straight days. Below we show a price chart of SPY since 1999 indicating each time when both ETFs experienced back to back to back 1%+ daily gains. In today’s Morning Lineup, we took a more detailed look at performance following these prior three peats. To see that analysis, sign up for a trial today!

Our Morning Lineup keeps readers on top of earnings data, economic news, global headlines, and market internals. We’re biased (of course!), but we think it’s the best and most helpful pre-market report in existence!
Start a two-week trial to Bespoke Premium to read today’s full Morning Lineup.
The Bespoke 50 Growth Stocks — 2/2/23
The “Bespoke 50” is a basket of noteworthy growth stocks in the Russell 3,000. To make the list, a stock must have strong earnings growth prospects along with an attractive price chart based on Bespoke’s analysis. The Bespoke 50 is updated weekly on Thursday unless otherwise noted. There were no changes to the list this week.
The Bespoke 50 is available with a Bespoke Premium subscription or a Bespoke Institutional subscription. You can learn more about our subscription offerings at our Membership Options page, or simply start a two-week trial at our sign-up page.

The Bespoke 50 performance chart shown does not represent actual investment results. The Bespoke 50 is updated weekly on Thursday. Performance is based on equally weighting each of the 50 stocks (2% each) and is calculated using each stock’s opening price as of Friday morning each week. Entry prices and exit prices used for stocks that are added or removed from the Bespoke 50 are based on Friday’s opening price. Any potential commissions, brokerage fees, or dividends are not included in the Bespoke 50 performance calculation, but the performance shown is net of a hypothetical annual advisory fee of 0.85%. Performance tracking for the Bespoke 50 and the Russell 3,000 total return index begins on March 5th, 2012 when the Bespoke 50 was first published. Past performance is not a guarantee of future results. The Bespoke 50 is meant to be an idea generator for investors and not a recommendation to buy or sell any specific securities. It is not personalized advice because it in no way takes into account an investor’s individual needs. As always, investors should conduct their own research when buying or selling individual securities. Click here to read our full disclosure on hypothetical performance tracking. Bespoke representatives or wealth management clients may have positions in securities discussed or mentioned in its published content.
Sentiment Streak Over
Given the collection periods ending last night at midnight at the absolute latest, the latest sentiment surveys would have hardly captured shifts in outlook following the latest FOMC decision or the strong market reaction to the FOMC. That is to say, the latest AAII sentiment survey can be considered a bit stale. Regardless, the latest week’s survey from AAII showed a modest increase in the percentage of respondents reporting as bullish. While still below the high of 31% from two weeks ago, 29.9% of investors reported as bullish this week.

It is a similar picture for bearish sentiment. 34.6% reported as bearish in the latest week which remains at the low end of the past year’s range of readings but slightly above the more recent low from two weeks ago.

Without any major shifts in bullish or bearish sentiment, bears continue to outnumber bulls as has been the case for a record 44 weeks in a row. That being said, the bull-bear spread has been showing single-digit readings for three weeks in a row. The only other time during the streak of negative readings that the same could be said was last August.


While the record streak of overall bearish sentiment readings lives on for the AAII survey, combining the AAII survey with other sentiment readings like the NAAIM Exposure Index and the Investors Intelligence survey shows sentiment is finally back to bullish, if even just barely. As shown in the first chart below, the average sentiment survey is now very slightly above historical average readings. That is the first time this has occurred in over a year, bringing to an end a record streak of negative readings. Click here to learn more about Bespoke’s premium stock market research service.

Layoffs Still Not Showing
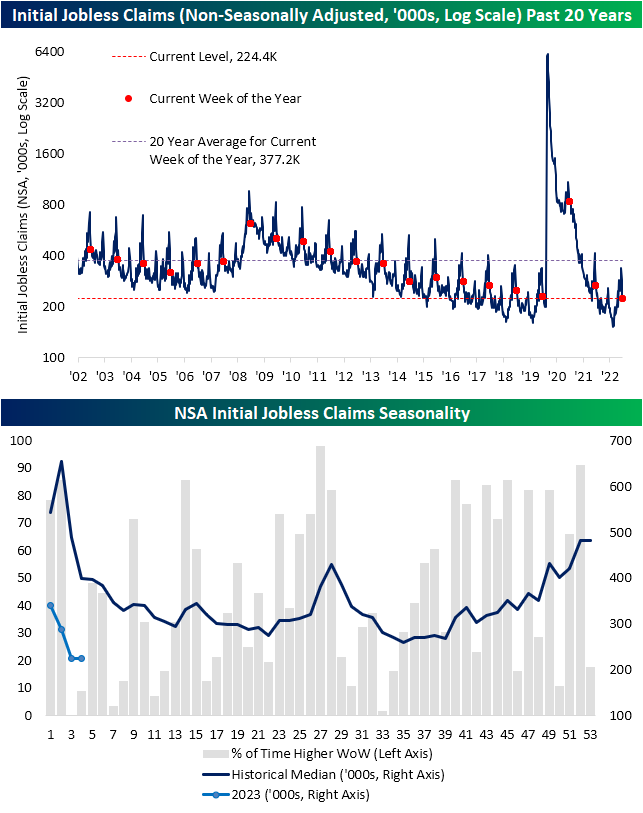
Jobless claims continue to impress with the latest reading on seasonally adjusted initial claims dropping to 183K which is the lowest level since April 2022. Claims have now declined in four of the last five weeks and have shown sub-200K prints in each of the past three weeks.

On a non-seasonally adjusted (NSA) basis, claims are falling sharply as would be seasonally normal at this point of the year. In fact, this week and last are two of the weeks of the year that have most consistently seen a lower sequential reading in claims on a historical basis. As shown in the second chart below, last week has never seen claims move higher week over week while the current week of the year has only seen an increase 9% of the time. While NSA claims were lower this week, it was not by much with the reading falling from 225.23K to just 224.36K. The only other time claims have fallen by less than 1K during the comparable week of the year was in 2006. Although the most recent week’s data was not as strong as might be expected given seasonality and that very well could be a result of recent layoffs, claims remain at historically strong levels.
As for continuing claims, which are lagged an additional week to the initial claims number, the latest reading came in at 1.655 million versus expectations for an increase to 1.684 million. Unlike initial claims, continuing claims are much further above last year’s lows, however, the past several weeks have marked a pause in what had been a steep uptrend that had developed in the back half of last year. Additionally, as for the actual level of claims, the most recent readings remain impressively strong and consistent with pre-pandemic levels that had not been seen in around 50 years. Click here to learn more about Bespoke’s premium stock market research service.

Bespoke’s Morning Lineup – 2/2/23 – Lots of Likes to Go Around
See what’s driving market performance around the world in today’s Morning Lineup. Bespoke’s Morning Lineup is the best way to start your trading day. Read it now by starting a two-week trial to Bespoke Premium. CLICK HERE to learn more and start your trial.
“If you just set out to be liked, you would be prepared to compromise on anything at any time, and you would achieve nothing.” – Margaret Thatcher
Below is a snippet of content from today’s Morning Lineup for Bespoke Premium members. Start a two-week trial to Bespoke Premium now to access the full report.
Ultimately, it all comes down to the fact that everyone just wants to be liked. After months of hawkish rhetoric even as inflation pressures started to ease, Powell has become as popular as the plague in financial circles, but yesterday he decided to tone it down a bit. It wasn’t a lot, but a comment like “We have no desire to overtighten”, was all the market needed. They took that centimeter and went miles with it. The Dow may have been flat on the day, but the S&P 500 finished up 1% and the Nasdaq tacked on a rally of 2%. We hear Powell even got a smile at the newsstand when he picked up the Post this morning (we’re not sure if it was the Washington or New York version). This morning futures are higher again as Meta’s stock surges close to 20%, but lower-than-expected Unit Labor Costs added another leg to the advance.
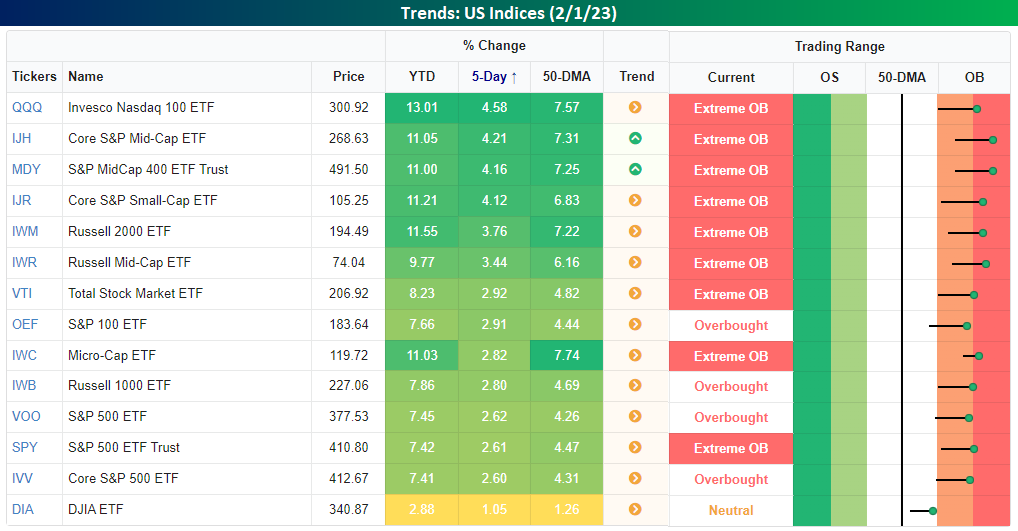
Except for the Dow, all of the major index ETFs in our Trend Analyzer finished the day at ‘overbought’ or ‘extreme overbought’ levels, and YTD they’re all (again excluding the Dow) up at least 7% YTD with many already up by double-digit percentages.
For the S&P 500, it finished the day 1.95 standard deviations above its 50-DMA. Since Powell became the Fed boss in February 2018, the only other time the S&P 500 was further above its 50-DMA on a Fed meeting day (scheduled or unscheduled) was on 11/3/21. That was the last meeting before Powell ditched the term ‘transitory’.

The S&P 500 has ‘passed’ a number of tests in recent weeks. First, it was the 200-DMA, and then it broke above its downtrend line from the highs in January 2022. Yesterday, the latest resistance to go by the wayside was the December peak which resulted in a higher high. Now, with the S&P 500 trading just under two standard deviations above its 50-DMA, it is at overbought levels where four prior rallies in the last 12 months have stalled out. Each milestone that the market crosses reinforces the sustainability of this rally, but on the way up, there are always ‘roadblocks’ ahead. They don’t call it a wall of worry for nothing!

Our Morning Lineup keeps readers on top of earnings data, economic news, global headlines, and market internals. We’re biased (of course!), but we think it’s the best and most helpful pre-market report in existence!
Start a two-week trial to Bespoke Premium to read today’s full Morning Lineup.
Bespoke’s Consumer Pulse Report — February 2023
Bespoke’s Consumer Pulse Report is an analysis of a huge consumer survey that we run each month. Our goal with this survey is to track trends across the economic and financial landscape in the US. Using the results from our proprietary monthly survey, we dissect and analyze all of the data and publish the Consumer Pulse Report, which we sell access to on a subscription basis. Sign up for a 30-day free trial to our Bespoke Consumer Pulse subscription service. With a trial, you’ll get coverage of consumer electronics, social media, streaming media, retail, autos, and much more. The report also has numerous proprietary US economic data points that are extremely timely and useful for investors.
We’ve just released our most recent monthly report to Pulse subscribers, and it’s definitely worth the read if you’re curious about the health of the consumer in the current market environment. Start a 30-day free trial for a full breakdown of all of our proprietary Pulse economic indicators.
