Fed Blackout Begins
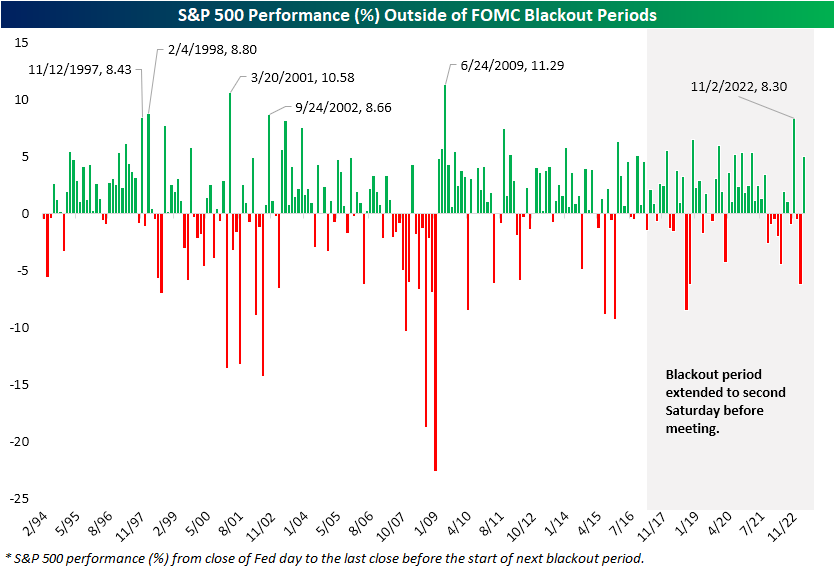
Saturday began the FOMC’s blackout period meaning there will be no communication from Fed officials for the next several days until the May 3rd meeting (Hooray). As of Monday afternoon, the CME’s FedWatch Tool is pricing in a nearly 90% chance of a 25 bps hike at that meeting.
In the chart below, we show the performance of the S&P 500 from the end of a Fed day until the start of the blackout period for each inter-meeting period since 1994 when the FOMC began announcing its rate decisions on the same day as the meetings. Since the current tightening cycle began a little over a year ago, most periods between meetings and blackouts have seen the S&P 500 turn lower with a median decline of 0.53%. One notable exception to that weakness was after the meeting last November when the S&P 500 went on to rally over 8% leading up to the blackout period. That was the strongest run for the S&P 500 from meeting to blackout since June 2009. As for more recently, the 5% gain from the March meeting through last Friday again stands out ranking as the second strongest of the current tightening cycle (out of ten).
In the chart below, we show the performance from the start of each past blackout period up through the last close prior to the FOMC meeting. Again, the current tightening cycle has tended toward weak performance for the S&P 500 with more declines than gains. However, the last blackout period in March saw the strongest gain for the S&P 500 since the runup to the June 2020 meeting.

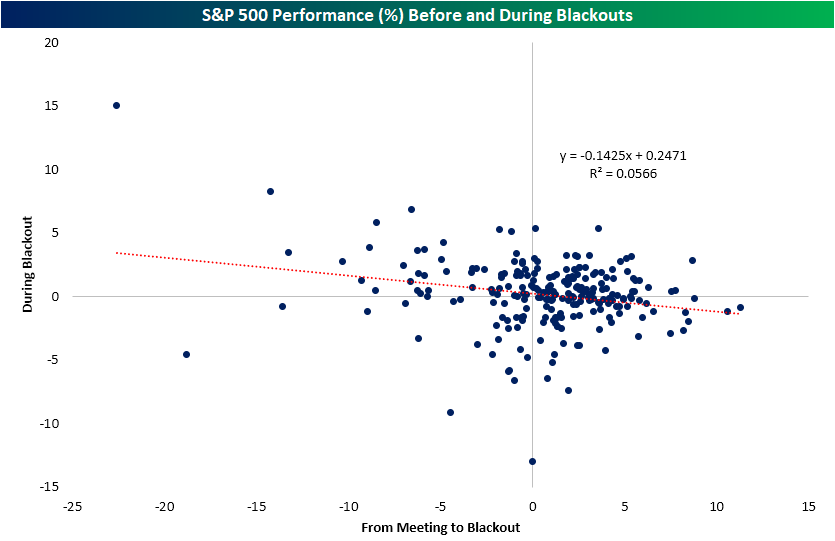
Although there has been some strength during and leading up to blackout periods more recently (especially relative to earlier this tightening cycle), over the full history of the data, strong performance ahead of the blackout period is not a good explainer of performance during the blackout period itself. As shown below, there has historically been a wide dispersion of results without much in the way of a trend. In other words, the strong performance headed into the blackout period in and of itself does not mean it will continue as Fed speakers go quiet.
Have you tried Bespoke All Access yet?
Bespoke’s All Access research package is quick-hitting, actionable, and easily digestible. Bespoke’s unique data points and analysis help investors better visualize underlying market trends to ultimately make more informed investment decisions.
Our daily research consists of a pre-market note, a post-market note, and our Chart of the Day. These three daily reports are supplemented with additional research pieces covering ETFs and asset allocation trends, global macro analysis, earnings and conference call analysis, market breadth and internals, economic indicator databases, growth and dividend income stock baskets, and unique interactive trading tools.
Click here to sign up for a one-month trial to Bespoke All Access, or you can read even more about Bespoke All Access here.

Bespoke’s Morning Lineup – 4/24/23 – Earnings On Deck
See what’s driving market performance around the world in today’s Morning Lineup. Bespoke’s Morning Lineup is the best way to start your trading day. Read it now by starting a two-week trial to Bespoke Premium. CLICK HERE to learn more and start your trial.
“It is not enough that we do our best; sometimes we must do what is required.” – Winston Churchill

Below is a snippet of content from today’s Morning Lineup for Bespoke Premium members. Start a two-week trial to Bespoke Premium now to access the full report.
In what is sure to be a very active week with respect to earnings, it’s starting off on a very quiet note as equity futures are little change and trading just barely below the flatline. Outside of Japan, which finished the session modestly higher, Asian stocks started the week on a negative note while most European benchmarks are little changed with a slight positive bias. In the Treasury market, yields are lower. On the economic calendar today, the only two reports are the Chicago Fed National Activity Index at 8:30 AM and the Dallas Fed Manufacturing report at 10:30.
In last weekend’s Bespoke Report, we highlighted the massive outperformance of European stocks relative to the US since the October lows. While Europe may be outperforming the US, it hasn’t been a global trend. The snapshot below from our Trend Analyzer shows the performance of international regional equity markets and where they finished last week relative to their trading ranges. Right at the top of the list are three ETFs whose focus is on Europe. They were among the best-performing international ETFs last week, the best performers YTD, and are all the most extended relative to their trading ranges.
Europe may have been higher last week, but Emerging Markets sold off. As shown at the bottom of the list, ETFs associated with Emerging Markets and Latin America were all at the bottom of the list and declined more than 1.5% last week. They are also some of the worst performers YTD and among the only ETFs in the group that aren’t overbought relative to their short-term trading ranges. The hardest hit on the week was Latin America where Chile’s proposed nationalization of its lithium industry hasn’t helped investor sentiment towards that area of the world.

The MSCI Emerging Markets ETF (EEM) has been in pretty much of a sideways trading range all year, but the technical picture is leaning more negative than positive. While EEM finished off its lows on Friday, it closed below its 50-day moving average (DMA) and has now seen both a lower low and a lower high.

Our Morning Lineup keeps readers on top of earnings data, economic news, global headlines, and market internals. We’re biased (of course!), but we think it’s the best and most helpful pre-market report in existence!
Start a two-week trial to Bespoke Premium to read today’s full Morning Lineup.
Bespoke Brunch Reads: 4/23/23
Welcome to Bespoke Brunch Reads — a linkfest of the favorite things we read over the past week. The links are mostly market related, but there are some other interesting subjects covered as well. We hope you enjoy the food for thought as a supplement to the research we provide you during the week.
While you’re here, join Bespoke Premium with a 30-day trial!
AI
ChatGPT Can Decode Fed Speak, Predict Stock Moves From Headlines by Justina Lee (Bloomberg/Yahoo!)
Academic papers applying ChatGPT and similar large language models to finance are starting to roll out and the initial results are broadly promising with ChatGPT doing a serviceable job interpreting stock headlines and Fed statements. [Link; auto-playing video]
Nvidia’s top A.I. chips are selling for more than $40,000 on eBay by Kif Leswing (CNBC)
Graphics cards that are optimal platforms for AI development and deployment are going for as much as $46k on eBay. Tens of thousands of the prior generation of chips led to the development of ChatGPT by OpenAI. [Link]
Environment
Let’s talk about the biggest cause of the West’s water crisis by Kenny Torella (Vox)
The vast majority of the Colorado River’s water gets spread onto fields irrigating crops; only about one-fifth goes to all non-crop uses. Of those crops, the vast majority are dedicated to feeding cows, with livestock feed crops sucking down a staggering 1.05 trillion gallons per year. [Link]
Pacific Ocean Garbage Patch Is Bursting With Life by Nidhi Subbaraman (WSJ)
Massive patches of plastic waste in the world’s oceans is both a major threat to some species and a comfortable ecological niche for dozens of species. [Link; paywall]
Office Woes
Brookfield Defaults on $161 Million Office-Property Debt by John Gittelsohn (Bloomberg)
The owner of a large swathe of office building has defaulted on a commercial mortgage-backed security tied to a package of Washington, DC properties. Brookfield has previously walked away from the debt tied to two LA towers. [Link; soft paywall, auto-playing video]
Houston, Dallas lead the country in office attendance — and empty office space by Dani Romero (Yahoo! Finance)
While Texas markets have lots of people back in the office, that doesn’t necessarily mean they have low vacancy rates with coastal markets finding far more paying renters for their inventory. [Link; auto-playing video]
Housing
Home Prices Fell 3% in March—Biggest Annual Drop in Over a Decade by Lily Katz (Redfin)
The sales price of the median home in March was down 3.3% YoY, the fastest drop since at least 2012 as soaring prices in pandemic boomtowns ground into reverse. [Link]
More Flexible Zoning Helps Contain Rising Rents by Alex Horowitz and Ryan Canavan (Pew)
A subset of cities and towns that have eased zoning restrictions appear to have avoided the worst of the national surge in rent, despite robust growth in those cities over the last few years. [Link]
How To Spend It
2022 the United States Average Federal Income Taxes Paid (National Priorities Project)
While taxes don’t directly finance spending in a fiat money system, the breakdown of dollar amounts scaled to tax bills are nonetheless a helpful insight into the things our country prioritizes spending on. [Link]
End-Cretaceous Asteroid Caused Massive Global Tsunami, Peaking At A Mile High (AGU)
The massive impact which ended dinosaurs’ time as the dominant life from on earth and paved the way for mammals to supplant them generated enormous waves that would have soaked land almost a mile above sea level. [Link]
Food
McDonald’s is upgrading its burgers by Danielle Wiener-Bronner (CNN)
Small tweaks including softer buns, gooier cheese, onions on the grill, and more Big Mac sauce are all steps being taken to improve the core product at McDonalds. [Link]
The Amazing Story of How Philly Cheesesteaks Became Huge in Lahore, Pakistan by Kunwar Khuldune Shahid (Philly Mag)
The iconic cheesesteak has become one of the favorite foods of Pakistan’s second city, finding fans for their accessibility and fragrance. [Link]
Feeling Good
They’re the Happiest People in America. We Called Them to Ask Why. by Aaron Zitner (WSJ)
Among the roughly one in ten Americans who report that they are “very happy”, two-thirds are very or moderately religious, a similar percentage prioritize marriage, and few attach high importance to their personal finances. [Link; paywall]
Read Bespoke’s most actionable market research by joining Bespoke Premium today! Get started here.
Have a great weekend!
The Bespoke Report – 4/21/23 – Are You Even Listening?
This week’s Bespoke Report newsletter is now available for members. (Log in here if you’re already a subscriber.)
The buildup to earnings season is always full of anticipation, but it usually starts off slowly as the pace of reports doesn’t usually really get going until the second full week of the reporting period. This earnings season has proved to be no different. While there were some notable reports from companies like Tesla (TSLA), Netflix (NFLX), Goldman Sachs (GS), Johnson & Johnson (JNJ), Lockheed Martin (LMT), IBM, AT&T (T), Taiwan Semi (TSM), and Procter & Gamble (PG), the real fireworks won’t be until next week when more of the mega-cap stocks start to report.
While equities escaped the week with just modest losses, they felt heavy for most of the week. As things stand now, both the S&P 500 and Nasdaq remain stuck in a sideways range and have stalled out at their February highs and remain well off their highs from last August. For all the talk about whether we’re in a new bull market or still stuck in a bear, at this point it seems like neither. If you want to call it a bear market, it looks about as savage as a koala, and if you’re going to go the bull route, it’s raging more like a cow than a bull.
Continue reading this week’s Bespoke Report newsletter by starting a one-month trial, or click the image below to view our membership options page.

Lithium: The Cycle Continues
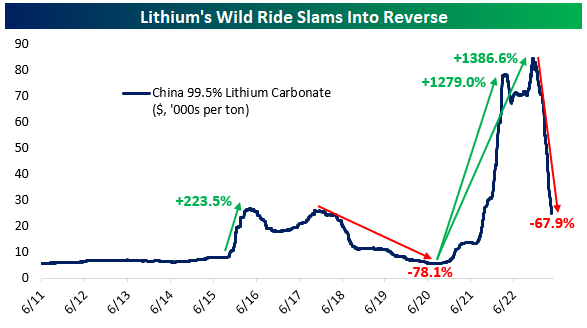
If you haven’t checked the price of lithium lately, you might be in for a surprise. Spot prices for lithium carbonate in China have collapsed by two-thirds since hitting record highs in November of last year. Prices have gone from $84k per ton to $25k per ton. That unwinds the vast majority of a spectacular surge that played out from 2020 to 2022. Lithium initially surged 1,279% from July 2020 to March 2022 as part of the broader explosion of commodity prices and booming demand for electric vehicles, eventually peaking up 1,387% from the post-COVID lows. It’s easy to forget that this critical battery input had already gone through one such cycle. A 224% rally in 6 months during late 2015 and early 2016 before a long, slow bear market that saw prices down 78% over several years.
In the equity market, the price cycle hasn’t been as dramatic in percentage terms, but there has still nonetheless been a double cycle of surging stock prices in 2016 followed by a grinding bear market, and then an even more dramatic surge through late 2022 that is now sliding into reverse. On Thursday, Chile’s government announced reforms to its lithium extraction policy. While existing contracts with firms that operate in the rich lithium brine deposits of the Chilean Atacama desert will be honored, the market is looking at weaker lithium prices and the fact that existing contracts will be replaced by less favorable ones 10+ years down the line and hitting lithium players. SQM is off 21% today while ALB is 10% lower.

Have you tried Bespoke All Access yet?
Bespoke’s All Access research package is quick-hitting, actionable, and easily digestible. Bespoke’s unique data points and analysis help investors better visualize underlying market trends to ultimately make more informed investment decisions.
Our daily research consists of a pre-market note, a post-market note, and our Chart of the Day. These three daily reports are supplemented with additional research pieces covering ETFs and asset allocation trends, global macro analysis, earnings and conference call analysis, market breadth and internals, economic indicator databases, growth and dividend income stock baskets, and unique interactive trading tools.
Click here to sign up for a one-month trial to Bespoke All Access, or you can read even more about Bespoke All Access here.
Earth Day 2023: “Invest in our Planet”
Tomorrow will mark Earth Day, an annual event in support of environmental protection. Befitting of this year’s theme “Invest in our Planet” in the charts below we check in on the performance of clean energy stocks via the iShares Global Clean Energy ETF (ICLN). As shown, ICLN has been stuck in a sideways trend over the past year with the 200-DMA essentially flat since the fall. At the moment, price is sandwiched between the 200-day and its 50-DMA. While time will tell if the 50-DMA provides any support, the past week has seen ICLN fail to break out of the downtrend off of last summer’s highs.

That downtrend also traces back even further to the early January 2021 high which was put in place following the massive run in clean energy stocks during the first year of the pandemic.

ICLN is comprised of a number of clean energy stocks from around the globe. In the snapshot from our Chart Scanner below, we show the ETF’s eight largest US-based holdings. As the ETF is trending sideways, these individual holdings’ trends are all over the place. For example, while Bloom Energy (BE) and Consolidated Edison (ED) are trending sideways, First Solar (FSLR) has been in a steady long-term uptrend. Conversely, Plug Power (PLUG) and Sunrun (RUN) have traded in steady downtrends for some time now with the former near 52-week lows.

Have you tried Bespoke All Access yet?
Bespoke’s All Access research package is quick-hitting, actionable, and easily digestible. Bespoke’s unique data points and analysis help investors better visualize underlying market trends to ultimately make more informed investment decisions.
Our daily research consists of a pre-market note, a post-market note, and our Chart of the Day. These three daily reports are supplemented with additional research pieces covering ETFs and asset allocation trends, global macro analysis, earnings and conference call analysis, market breadth and internals, economic indicator databases, growth and dividend income stock baskets, and unique interactive trading tools.
Click here to sign up for a one-month trial to Bespoke All Access, or you can read even more about Bespoke All Access here.
Bespoke’s Morning Lineup – 4/21/23 – Crawling into the Weekend
See what’s driving market performance around the world in today’s Morning Lineup. Bespoke’s Morning Lineup is the best way to start your trading day. Read it now by starting a two-week trial to Bespoke Premium. CLICK HERE to learn more and start your trial.
“By day the banished sun circles the earth like a grieving mother with a lamp.” – Cormac McCarthy
Below is a snippet of content from today’s Morning Lineup for Bespoke Premium members. Start a two-week trial to Bespoke Premium now to access the full report.
Futures this morning have moved modestly into positive territory after trading lower overnight, but after two straight days of modest declines for stocks, there’s a heavy feeling into the weekend. The only economic data on the calendar this morning are preliminary PMI data for April from S&P. In reports for other countries we have seen already this morning, the general trend has been one of weaker readings in manufacturing and improvement in services.
Treasuries are generally trading higher this morning with the biggest moves coming at the short end of the curve. In Fedspeak overnight, Philadelphia Fed President Patrick Harker made some common sense comments when he said that “We need to be a little cautious here to not just respond to the current level of inflation, but where we think it’s going.”
With tomorrow being Earth Day, we wanted to take a quick look at how global equities look heading into the weekend and as we’re close to four full months into the (no longer) new year. While the S&P 500 has been struggling to even take out its February high, the highs from last August before Powell’s Jackson Hole speech tanked the market still loom above. Global equities, however, have fared better. In addition to trading right at the February highs, the MSCI All Country World ETF (ACWI) is also right at the highs from last August as the low-$90s range is a level that has acted as resistance multiple times in the last seven months. Bulls will point to the fact that during the pullback that followed the last unsuccessful breakout, ACWI made a higher low, while bears will highlight the fact that volume during the last leg higher was anemic. Whichever way it breaks from here, though, the move is likely to be a significant one.

Our Morning Lineup keeps readers on top of earnings data, economic news, global headlines, and market internals. We’re biased (of course!), but we think it’s the best and most helpful pre-market report in existence!
Start a two-week trial to Bespoke Premium to read today’s full Morning Lineup.
Homebuilders Breaking Out Like It’s…
It’s hard to get over how well the homebuilder stocks have been performing lately. As shown in the charts below of stocks in the S&P 1500 Homebuilder group, these names are nearly universally in steep six-month uptrends and breaking out as we type.
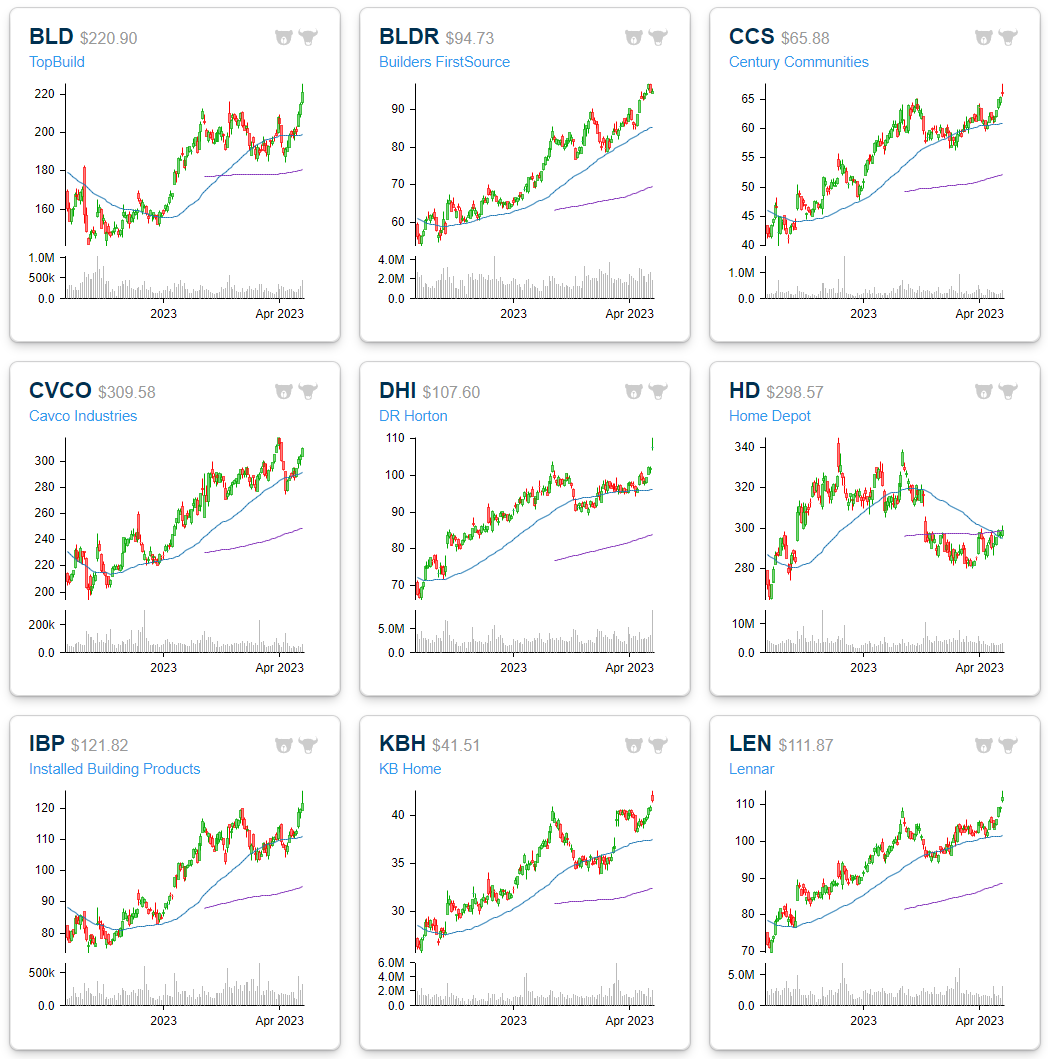
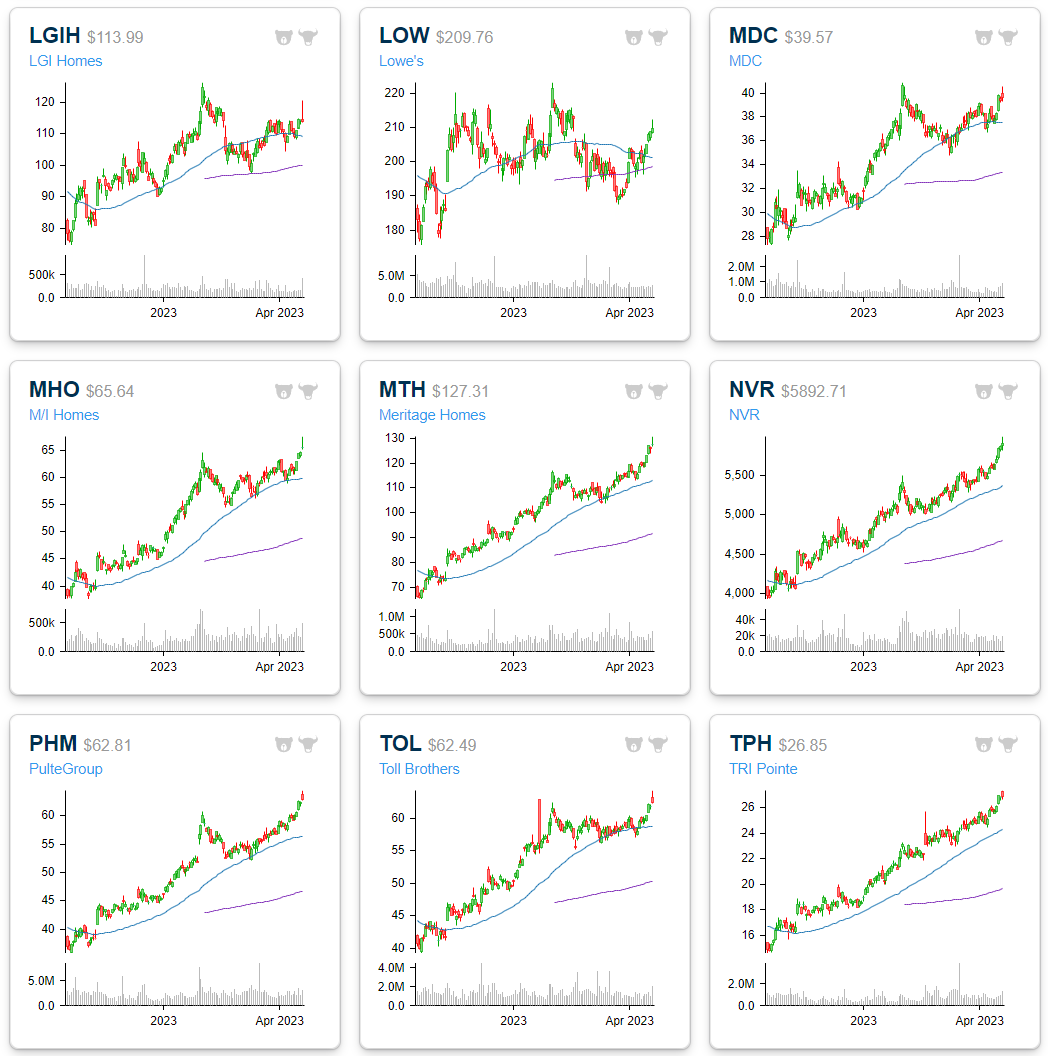
Below is another way to see just how crazy the run has been for the S&P 1500 Homebuilder stocks lately. Most names are now up 30-40% year-to-date after rallying 5-10% over the last week. This has pushed them ~10% above their 50-DMAs, and many are trading more than two (or even three for some) standard deviations above their 50-DMAs in extreme overbought territory.
“Mr. Market” has either lost its mind or it’s predicting that all the current worries about housing in the months and quarters ahead are misguided.

Have you tried Bespoke All Access yet?
Bespoke’s All Access research package is quick-hitting, actionable, and easily digestible. Bespoke’s unique data points and analysis help investors better visualize underlying market trends to ultimately make more informed investment decisions.
Our daily research consists of a pre-market note, a post-market note, and our Chart of the Day. These three daily reports are supplemented with additional research pieces covering ETFs and asset allocation trends, global macro analysis, earnings and conference call analysis, market breadth and internals, economic indicator databases, growth and dividend income stock baskets, and unique interactive trading tools.
Click here to sign up for a one-month trial to Bespoke All Access, or you can read even more about Bespoke All Access here.
Jobless Claims Nearing New Highs
Jobless claims have continued to weaken with this week’s release, rising by 5K to 245K versus expectations of no change from last week’s upwardly revised 240K print. At current levels, claims sit at the high end of the range since the start of 2022 and only a couple thousand below last month’s high.

Prior to seasonal adjustment, claims have essentially come in right inline with the reading for the same week last year and the few years prior to the pandemic. As shown in the second chart below, claims tend to experience a little bit of a bounce around this point of the year before resuming a move lower through the late spring.

Continuing claims were equally disappointing this week rising to 1.865 million, 40K above expectations. Although the increase to initial claims has not resulted in a new high, the 61K increase for continuing claims leaves the indicator at the highest level since late November 2021.

Have you tried Bespoke All Access yet?
Bespoke’s All Access research package is quick-hitting, actionable, and easily digestible. Bespoke’s unique data points and analysis help investors better visualize underlying market trends to ultimately make more informed investment decisions.
Our daily research consists of a pre-market note, a post-market note, and our Chart of the Day. These three daily reports are supplemented with additional research pieces covering ETFs and asset allocation trends, global macro analysis, earnings and conference call analysis, market breadth and internals, economic indicator databases, growth and dividend income stock baskets, and unique interactive trading tools.
Click here to sign up for a one-month trial to Bespoke All Access, or you can read even more about Bespoke All Access here.
Bulls Keep Coming Back
The S&P 500 has been little changed in the past week resulting in little change to sentiment according to the latest AAII survey. 27.2% of respondents reported as bullish this week, up 1.1 percentage points versus the previous week. Albeit higher, that does not result in any sort of new high as bullish sentiment sits right in the middle of the past year’s range

Bearish sentiment likewise picked up this week rising from 34.5% to 35.1%. That is only the highest level in three weeks as bearish sentiment remains relatively muted versus the significantly elevated readings of the past year.

With that said, sentiment continued to favor bearishness with the bull-bear spread sitting at -7.9. This week marks the ninth in a row in which bearish sentiment outweighed bullish sentiment.

Given both bullish and bearish readings rose, each group borrowed from the neutral pool which pivoted off of a recent high of 39.5% down to a still elevated 37.7%.
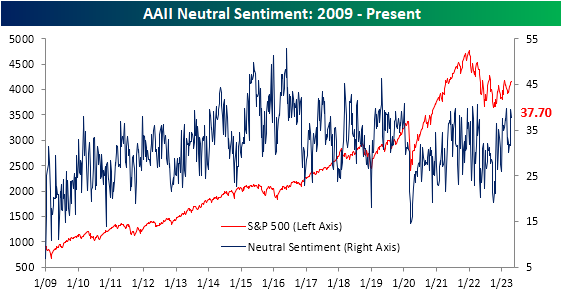
Factoring in other sentiment surveys, there was more bullish tones. The NAAIM Exposure index indicated active managers added long exposure to equities and the Investors Intelligence survey showed the highest bull-bear spread since the first week of 2022. That leaves the AAII survey as the only one of the three with sentiment readings that are more bearish than historically normal.

Have you tried Bespoke All Access yet?
Bespoke’s All Access research package is quick-hitting, actionable, and easily digestible. Bespoke’s unique data points and analysis help investors better visualize underlying market trends to ultimately make more informed investment decisions.
Our daily research consists of a pre-market note, a post-market note, and our Chart of the Day. These three daily reports are supplemented with additional research pieces covering ETFs and asset allocation trends, global macro analysis, earnings and conference call analysis, market breadth and internals, economic indicator databases, growth and dividend income stock baskets, and unique interactive trading tools.
Click here to sign up for a one-month trial to Bespoke All Access, or you can read even more about Bespoke All Access here.