Bespoke’s Morning Lineup – 5/4/23 – Inequality in Commodities
See what’s driving market performance around the world in today’s Morning Lineup. Bespoke’s Morning Lineup is the best way to start your trading day. Read it now by starting a two-week trial to Bespoke Premium. CLICK HERE to learn more and start your trial.
“When you blow away the foam, you get down to the real stuff.” – T. Boone Pickens

Below is a snippet of content from today’s Morning Lineup for Bespoke Premium members. Start a two-week trial to Bespoke Premium now to access the full report.
After a relatively hawkish tone from Fed Chair Powell where he reiterated his view that the regional banking system is doing fine, reports surfaced that PacWest (PACW) is mulling strategic options for its business. Shares of PACW and other regional banks immediately plunged on the idea that things really aren’t fine, and that pulled futures for the broader market lower as well. In earnings news, shares of Qualcomm (QCOM) are down over 7% after the company reported weaker-than-expected EPS and lowered guidance. QCOM’s weak earnings report suggests that sales of handsets have been weak, and on that news, Apple (AAPL) is also trading lower heading into its earnings report after the close.
On the economic calendar today, jobless claims are the primary focus, but we also got updates on Non-Farm Productivity and Unit Labor Costs. Initial claims were slightly higher than expected (242K vs 240K) while Continuing Claims were significantly lower than expected (1.805 million vs 1.865 million). Non-Farm Productivity fell 2.7% versus forecasts for a decline of 2.0%, and Unit Labor Costs rose 6.3% compared to estimates of 5.6%.
All the headlines surrounding the troubles in the banking sector have weighed on sentiment in the last week as the AAII sentiment survey showed that bulls were unchanged at 24.1%, but bullish sentiment jumped from 38.5% up to 44.9%.
When it comes to trends within individual asset classes, the typical pattern is one of a tide lifting or sinking all boats. While it hasn’t necessarily been the case over the last two years, when the stock market rallies, most individual stocks rally and vice versa. Similarly, when bonds rally rates usually fall, even if the move lower is to varying degrees. One area of financial markets where we have been seeing a wide degree of disparity within the asset class is commodities.
The snapshot from our Trend Analyzer below shows where various commodity-related ETS currently stand relative to their trading ranges. At the top of the list and all trading in overbought territory are ETFs related to precious metals like gold and silver. Most of them are also up by double-digit percentages YTD. While these ETFs have performed well both recently and on a YTD basis, most other ETFs in the sector are down sharply YTD and trading at oversold levels. Crude oil ETFs like USO and DBO are down 7% over the last week while Natural Gas is sitting on a 55% YTD decline after falling an ominous 6.66% over the last five trading days. Is it getting hot in here?

Start a two-week trial to Bespoke Premium to read today’s full Morning Lineup.
The Triple Play Report — 5/3/23
An earnings triple play is a stock that reports earnings and manages to 1) beat analyst EPS estimates, 2) beat analyst sales estimates, and 3) raise forward guidance. You can read more about “triple plays” at Investopedia.com where they’ve given Bespoke credit for popularizing the term. We like triple plays as an indication that a company’s business is firing on all cylinders, with above-expectations results and an improving outlook. A triple play is indicative of positive “fundamental momentum” instead of pure fundamentals, and there are always plenty of names with both high and low valuations on our quarterly list.
Bespoke’s Triple Play Report highlights companies that have recently reported earnings triple plays, and it features commentary from management on triple-play conference calls, company descriptions and analysis, and price charts. Bespoke’s Triple Play Report is available at the Bespoke Institutional level only. You can sign up for Bespoke Institutional now and receive a 14-day trial to read this week’s Triple Play Report, which features seven stocks. To sign up, choose either the monthly or annual checkout link below:
Bespoke Institutional – Monthly Payment Plan
Bespoke Institutional – Annual Payment Plan

Fixed Income Weekly: 5/3/23
Searching for ways to better understand the fixed income space or looking for actionable ideas in this asset class? Bespoke’s Fixed Income Weekly provides an update on rates and credit every Wednesday. We start off with a fresh piece of analysis driven by what’s in the headlines or driving the market in a given week. We then provide charts of how US Treasury futures and rates are trading, before moving on to a summary of recent fixed income ETF performance, short-term interest rates including money market funds, and a trade idea. We summarize changes and recent developments for a variety of yield curves (UST, bund, Eurodollar, US breakeven inflation and Bespoke’s Global Yield Curve) before finishing with a review of recent UST yield curve changes, spread changes for major credit products and international bonds, and 1 year return profiles for a cross section of the fixed income world.
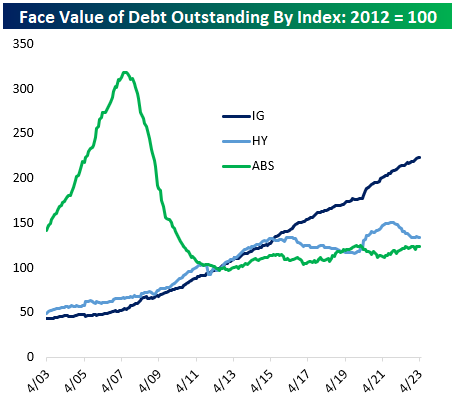
In this week’s report, we track investment grade corporate bond issuance.
Our Fixed Income Weekly helps investors stay on top of fixed-income markets and gain new perspectives on the developments in interest rates. You can sign up for a Bespoke research trial below to see this week’s report and everything else Bespoke publishes free for the next two weeks!
Click here and start a 14-day free trial to Bespoke Institutional to see our newest Fixed Income Weekly now!
Bespoke’s Morning Lineup – 5/3/23
See what’s driving market performance around the world in today’s Morning Lineup. Bespoke’s Morning Lineup is the best way to start your trading day. Read it now by starting a two-week trial to Bespoke Premium. CLICK HERE to learn more and start your trial.
“Men in general judge more from appearances than from reality. All men have eyes, but few have the gift of penetration.” ― Niccolo Machiavelli
Below is a snippet of content from today’s Morning Lineup for Bespoke Premium members. Start a two-week trial to Bespoke Premium now to access the full report.
If you were to apply the quote above to the markets, it would be that you should never invest based on the headlines.
It was nice while it lasted, but the Fed blackout will come to an end this afternoon when the FOMC announces its latest decision on interest rates and Powell holds a 2:30 PM Eastern press conference. There’s a bit of a positive tone in the markets ahead of the announcement, but that will all change later on. The ADP Employment report crushed estimates surpassing forecasts by more than 100K, and while it hasn’t been particularly reliable in forecasting the Non-Farm Payrolls report, the strong reading suggests that the labor market is holding up even after yesterday’s weaker JOLTS report. We’ll have to wait and see jobless claims and Non-Farm Payrolls later this week to get a better read on that sector. As far as the rest of the day is concerned, we still have ISM Services at 10 AM.
As large caps have carried the lion’s share of the weight in market performance this year, the performance gap between the Nasdaq 100 and the Russell 2000 has really widened. Year to date, the Nasdaq 100 has rallied by 19.9% while the Russell 2000 has declined nearly 2%, and over the last six months, the gap has been similar at 19.8%. The chart below shows the rolling six-month performance spread between the two indices, and while the spread has spiked in the last few months, it’s still lower than it was at post-COVID extremes in the fall of 2021 and the middle of 2020. At the other extreme, the peak period of outperformance for the Russell 2000 was in Mach 2021 when US consumers were flush with stimulus cash. Over the last 13 years, though, the performance gap has been in the Nasdaq 100’s favor as the spread has been positive 65% of the time since 2010.

With the gap in performance favoring the Nasdaq 100 nearly two-thirds of the time over the last 13 years, its relative strength versus the Russell 2000 has, up until recent years, been in a consistent uptrend. After going parabolic in the early COVID days, relative strength has been in a sideways range for three years now. Tighter credit conditions from the regional banking crisis this year have recently helped buoy the performance of large caps. Now, with the Fed on tap this afternoon, will Powell continue the hawkish tone and keep a tight grip on the credit spigot for smaller companies, or will he take a softer tone and help grease the skids?

Start a two-week trial to Bespoke Premium to read today’s full Morning Lineup.
Bespoke’s Morning Lineup – 5/2/23 – Changing Roles
See what’s driving market performance around the world in today’s Morning Lineup. Bespoke’s Morning Lineup is the best way to start your trading day. Read it now by starting a two-week trial to Bespoke Premium. CLICK HERE to learn more and start your trial.
“Time takes it all, whether you want it to or not.” – Stephen King, The Green Mile
Below is a snippet of content from today’s Morning Lineup for Bespoke Premium members. Start a two-week trial to Bespoke Premium now to access the full report.
Markets look to be starting off on a sluggish note this morning as Europe returns from the long holiday weekend to some mixed economic data regarding manufacturing and inflation while the Australian central bank announced a hawkish surprise at its policy meeting by hiking rates 25 bps. In the US, futures are just moderately lower ahead of the 10 AM release of the JOLTS- the first of many employment-related indicators on top for the week. Speaking of employment, Bloomberg is reporting that Morgan Stanley plans to lay off 3,000 employees, while IBM will halt hiring and replace up to 7,800 positions and replace them with AI.
The more things change, the more they stay the same. You’ve heard the phrase thousands of times before, and it’s uncanny how often it applies to real-world situations. This morning, though, we wanted to show you an example of how things this year couldn’t be more different than they were last year. Through the end of April last year, the three worst-performing sectors on a YTD basis were Communication Services (XLC), Consumer Discretionary (XLY), and Technology (XLK), while Energy (XLE) was the only sector with any meaningful gains. This year, through yesterday’s close, the three best-performing sectors on a YTD basis have been Communication Services, Technology, and Consumer Discretionary while the worst-performing sector has been Energy. So basically, this year’s market leaders and laggards couldn’t be more opposite from each other.
The only sectors that have been exceptions in any way are Consumer Staples (which is the only sector that was up YTD in both 2022 and 2023) and Financials and Health Care (which are the only two sectors that were down YTD in both 2022 and 2023). When it comes to sector performance so far this year, the more things change, the more they change. Then again, when it comes to broader market concerns, the Fed still seems to be all anyone can focus on, economic indicators suggest weakness or even a recession on the horizon, and the war in Ukraine is still going.

Start a two-week trial to Bespoke Premium to read today’s full Morning Lineup.
Bespoke Market Calendar — May 2023
Please click the image below to view our May 2023 market calendar. This calendar includes the S&P 500’s historical average percentage change and average intraday chart pattern for each trading day during the upcoming month. It also includes market holidays and options expiration dates plus the dates of key economic indicator releases. Click here to view Bespoke’s premium membership options.

Bespoke’s Morning Lineup – 5/1/23 – May-be May-be Not
See what’s driving market performance around the world in today’s Morning Lineup. Bespoke’s Morning Lineup is the best way to start your trading day. Read it now by starting a two-week trial to Bespoke Premium. CLICK HERE to learn more and start your trial.
“I am not responsible, but I will find out who is.” – J.P. Morgan
Below is a snippet of content from today’s Morning Lineup for Bespoke Premium members. Start a two-week trial to Bespoke Premium now to access the full report.
Even with First Republic going into receivership over the weekend, it’s a quiet morning in the futures market. Perhaps it’s because you couldn’t have had a more telegraphed bank failure or simply that most world markets are closed for May Day. Economic data overnight has been mixed in the few reports that have been released so far, but we’ll have to wait until tomorrow to get the full barrage of data as markets that are closed today reopen for trading. One notable weak spot in the PMI data was China where both the Manufacturing and Services sector reports were weaker than expected (manufacturing below 50 and services above).
This week will be an extremely busy one for economic data with ISM Manufacturing today, ADP Employment, ISM Services, and the FOMC Wednesday, Jobless Claims on Thursday, and then the Employment report Friday. Oh, and don’t forget about earnings too.
Despite the tumultuous issues in the US banking system and specifically the demise of First Republic (FRC), US stocks managed to finish the week higher capping off what has been a rally of over 8% for the S&P 500 in the first four months of the year and a rally of nearly double that in the Nasdaq composite. The only blemish is the small-cap Russell 2000 which is barely hanging on to gains for the year. While a lot of attention is placed on the small caps, though, keep in mind that the Russell 2000’s entire market cap is less than Apple’s (AAPL)!
Now that the first four months are behind us, we’re at the dreaded point of the year where it’s time to sell in May, although as most aware and we pointed out last week, there’s some nuance to that. The chart below summarizes the performance of S&P 500 sectors during the month of May going back to 2000. Over the last 23 years, every sector except for Telecom Services (now Communication Services) has had gains during the month of May on a median basis, and the S&P 500’s median performance has been a gain of 1.07% with gains 70% of the time. Small caps, which have lagged so badly this year, have tended to perform even better with a median gain of 1.51% and gains 61% of the time.
Looking at individual sectors, Technology has been the clear winner as it’s the only one with a median gain of over 2% (although positive just 57% of the time). There’s been a lot of volatility for the sector, though, as it has seen a move of +/-5% during the month more than half of the time. The only other sectors with median gains of more than 1.5% have been Financials (1.70%) and Materials (1.66%), but both sectors have only been positive during the month 61% of the time. Speaking of consistency, the only three sectors that have been up during May more than two-thirds of the time are Health Care (74%), Real Estate (74%), and Consumer Staples (70%).

Start a two-week trial to Bespoke Premium to read today’s full Morning Lineup.
The Bespoke Report — Equity Market Pros and Cons — Q2 2023
This week’s Bespoke Report is an updated version of our “Pros and Cons” edition for Q2 2023.
With this report, you’re able to get a complete picture of the bull and bear case for US stocks right now. It’s heavy on graphics and light on text, but we let the charts and tables do the talking!
On page three of the report, you’ll see a full list of the pros and cons that we lay out. Slides for each topic are then provided on page four and beyond.
To read this report and access everything else Bespoke’s research platform has to offer, start a two-week trial to Bespoke Premium.


“Big” Winners
Whenever you see a list of best-performing stocks, it’s inevitably loaded with many small stocks that most investors have never heard of. This year, though, it’s practically been the opposite trend as the two top performing stocks in the S&P 500 on a YTD basis – Meta Platforms (+96%) and Nvidia (+88%) – are not only household names, but they also have market caps of more than $500 billion. We’d also note that both stocks are more than 30 percentage points ahead of the next closest stocks in terms of top YTD returns!
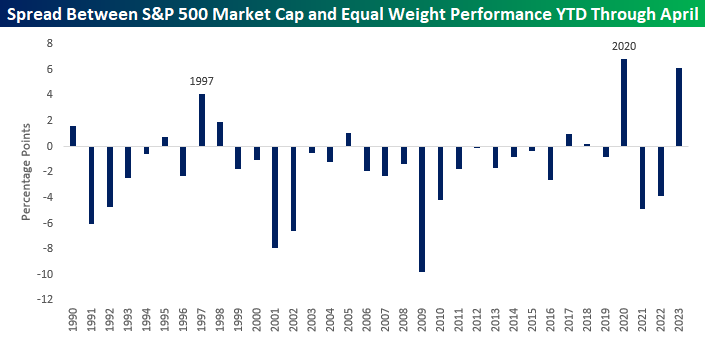
With such strong returns among the largest stocks in the S&P 500, the YTD performance spread between the market-cap-weighted S&P 500 and its equal-weighted counterpart is among the widest ever seen on a YTD basis through the end of April. Through Friday afternoon, the market-cap-weighted S&P 500 was up 8.26% YTD, while the equal-weighted index was up just 2.13%. At 6.14 percentage points, the YTD performance gap between the two indices is the second widest since 1990, trailing only the 6.8% percentage point gap in 2020. Besides 2020, the only other year where the gap was wider than two percentage points was in 1997. While it’s a small sample size and history doesn’t always repeat itself, we’d note that the S&P 500’s rest-of-year performance was a gain of over 20% in both of those years. Just saying.
Besides the two other years where the performance gap was significantly wide like this year, what stands out about the chart below is how common it has historically been for the market cap-weighted index to underperform the equal weight index in the first four months of the year. Including this year, the cap-weighted index has only outperformed nine times in the last 34 years.
Have you tried Bespoke All Access yet?
Bespoke’s All Access research package is quick-hitting, actionable, and easily digestible. Bespoke’s unique data points and analysis help investors better visualize underlying market trends to ultimately make more informed investment decisions.
Our daily research consists of a pre-market note, a post-market note, and our Chart of the Day. These three daily reports are supplemented with additional research pieces covering ETFs and asset allocation trends, global macro analysis, earnings and conference call analysis, market breadth and internals, economic indicator databases, growth and dividend income stock baskets, and unique interactive trading tools.
Click here to sign up for a one-month trial to Bespoke All Access, or you can read even more about Bespoke All Access here.

Bespoke’s Matrix of Economic Indicators – 4/28/23
Our Matrix of Economic Indicators provides a concise summary analysis of the US economy’s momentum. We combine trends across the dozens and dozens of economic indicators in various categories like manufacturing, employment, housing, the consumer, and inflation to provide a directional overview of the economy.
To access our newest Matrix of Economic Indicators, start a two-week free trial to either Bespoke Premium or Bespoke Institutional now!