Stock Seasonality – 3/12/18
This content is for members onlyS&P 500 Stock Seasonality: 3/5/18
While we don’t ever suggest that investors should base their trading solely on the calendar, there is evidence that the market and many stocks do indeed follow seasonal patterns. This makes our S&P 500 Stock Seasonality report a useful addition to every investor’s toolbox. Using the last ten years worth of price data, our Stock Seasonality report looks at the average returns for the S&P 500, its eleven sectors, and its 500 individual stocks. In the report, we highlight the five stocks in each sector that have historically been the best and worst performers over the next two weeks. For each stock, we also include information such as average returns, the percent of time each stock or sector is positive/outperforms the S&P 500, and its historical performance over the next two weeks for each of the last ten years. The Stock Seasonality report is published on a weekly basis on Mondays, and it is available to all Bespoke Premium and Bespoke Institutional subscribers.
This week’s stock that we have chosen to highlight is Altria Group (MO). When it comes to defensive stocks, they don’t get much more defensive than MO, but in the upcoming two-week period at least, the stock has been a dud. As shown in the chart below, the stock has traded lower from the close on 3/5 through 3/19 in nine of the last ten years for a median decline of 1.9%. The last year that the stock was up during this period was in 2009, right when the rest of the market was going up in smoke.

For active traders, our Stock Seasonality report is an excellent tool to help keep track of the best and worst times of year for the overall market, sectors and individual stocks. To see the report, sign up for a monthly Bespoke Premium membership now!
Stock Seasonality: 2/26/18
While we don’t ever suggest that investors should base their trading solely on the calendar, there is evidence that the market and many stocks do indeed follow seasonal patterns. This makes our S&P 500 Stock Seasonality report a useful addition to every investor’s toolbox. Using the last ten years worth of price data, our Stock Seasonality report looks at the average returns for the S&P 500, its eleven sectors, and its 500 individual stocks. In the report, we highlight the five stocks in each sector that have historically been the best and worst performers over the next two weeks. For each stock, we also include information such as average returns, the percent of time each stock or sector is positive/outperforms the S&P 500, and its historical performance over the next two weeks for each of the last ten years. The Stock Seasonality report is published on a weekly basis on Mondays, and it is available to all Bespoke Premium and Bespoke Institutional subscribers.
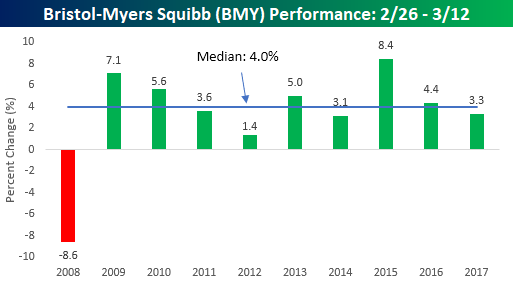
This week’s stock that we have chosen to highlight is Bristol-Myers Squibb (BMY). BMY typically doesn’t trade in as wide a range as other stocks in the market, but in the upcoming two-week period it has been remarkably consistent. BMY hasn’t traded down during the upcoming two-week period since 2008. Overall, the stock’s median gain during this period is a gain of 4.0%.
For active traders, our Stock Seasonality report is an excellent tool to help keep track of the best and worst times of year for the overall market, sectors and individual stocks. To see the report, sign up for a monthly Bespoke Premium membership now!
Stock Seasonality: 2/20/18
While we don’t ever suggest that investors should base their trading solely on the calendar, there is evidence that the market and many stocks do indeed follow seasonal patterns. This makes our S&P 500 Stock Seasonality report a useful addition to every investor’s toolbox. Using the last ten years worth of price data, our Stock Seasonality report looks at the average returns for the S&P 500, its eleven sectors, and its 500 individual stocks. In the report, we highlight the five stocks in each sector that have historically been the best and worst performers over the next two weeks. For each stock, we also include information such as average returns, the percent of time each stock or sector is positive/outperforms the S&P 500, and its historical performance over the next two weeks for each of the last ten years. The Stock Seasonality report is published on a weekly basis on Mondays, and it is available to all Bespoke Premium and Bespoke Institutional subscribers.
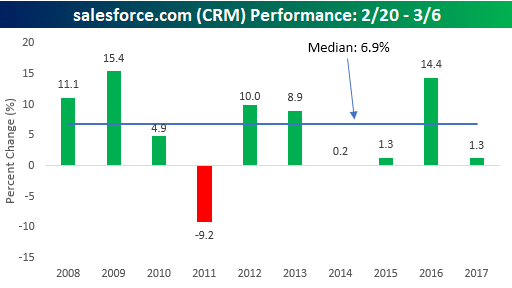
This week’s stock that we have chosen to highlight is salesforce.com (CRM). CRM typically reports Q4 earnings late in the month of February, and this year is scheduled to report after the close on 2/28. Historically speaking, investors have liked what they have seen in the report. As shown in our Earnings Screener, the stock has gapped up following its Q4 report in eight of the last ten years, and in many cases by double-digit percentages. Overall, in the two-week period from the close on 2/20 through the close on 3/6, CRM has seen a median gain of 6.9% with gains in all but one year. That one year where the stock declined was in 2011, but it wasn’t the earnings that dinged the stock back then, because on its earnings reaction day, CRM rallied close to 5%.
For active traders, our Stock Seasonality report is an excellent tool to help keep track of the best and worst times of year for the overall market, sectors, and individual stocks. To see the report, sign up for a monthly Bespoke Premium membership now!
S&P 500 Stock Seasonality: 2/12/18
While we don’t ever suggest that investors should base their trading solely on the calendar, there is evidence that the market and many stocks do indeed follow seasonal patterns. This makes our S&P 500 Stock Seasonality report a useful addition to every investor’s toolbox. Using the last ten years worth of price data, our Stock Seasonality report looks at the average returns for the S&P 500, its eleven sectors, and its 500 individual stocks. In the report, we highlight the five stocks in each sector that have historically been the best and worst performers over the next two weeks. For each stock, we also include information such as average returns, the percent of time each stock or sector is positive/outperforms the S&P 500, and its historical performance over the next two weeks for each of the last ten years. The Stock Seasonality report is published on a weekly basis on Mondays, and it is available to all Bespoke Premium and Bespoke Institutional subscribers.
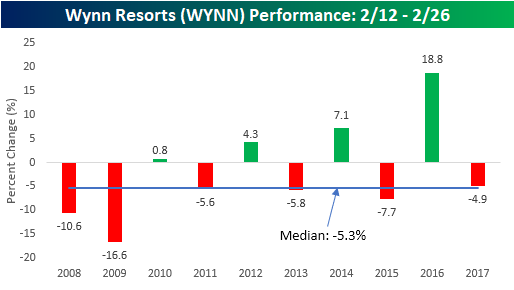
One stock that we wanted to highlight this week is Wynn Resorts (WYNN). As if things weren’t bad enough for the company given the controversies surrounding Steve Wynn, the stock is also now entering what has historically been one of the weakest times of the year for the stock. As shown in the chart below, WYNN has traded lower during the upcoming two-week period in six of the last ten years for a median decline of 5.3%. That makes it the worst performing stock for the upcoming two-week period in the S&P 500.
For active traders, our Stock Seasonality report is an excellent tool to help keep track of the best and worst times of year for the overall market, sectors, and individual stocks. To see the report and which two stocks have performed even better than EA in the upcoming two-week period, sign up for a monthly Bespoke Premium membership now!