Feb 5, 2018
While we don’t ever suggest that investors should base their trading solely on the calendar, there is evidence that the market and many stocks do indeed follow seasonal patterns. This makes our S&P 500 Stock Seasonality report a useful addition to every investor’s toolbox. Using the last ten years worth of price data, our Stock Seasonality report looks at the average returns for the S&P 500, its eleven sectors, and its 500 individual stocks. In the report, we highlight the five stocks in each sector that have historically been the best and worst performers over the next two weeks. For each stock, we also include information such as average returns, the percent of time each stock or sector is positive/outperforms the S&P 500, and its historical performance over the next two weeks for each of the last ten years. The Stock Seasonality report is published on a weekly basis on Mondays, and it is available to all Bespoke Premium and Bespoke Institutional subscribers.
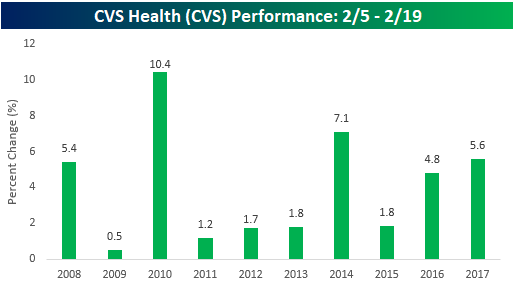
One stock that we wanted to highlight this week is CVS Health (CVS). CVS hasn’t been the top performing stock in the S&P 500 during the upcoming two-week period from 2/5 through 2/19, but it has been remarkably consistent. As shown in the chart below, the stock has been up during this two-week period for ten straight years for a median gain of 3.3%. Must be a boost from all the flu patients rushing for supplies to help ease the pain! Along with CVS, there are another six S&P 500 stocks that have been positive during the upcoming two-week period for ten straight years, including two that have seen median gains in excess of 7%.
For active traders, our Stock Seasonality report is an excellent tool to help keep track of the best and worst times of year for the overall market, sectors, and individual stocks. To see the report and which two stocks have performed even better than EA in the upcoming two-week period, sign up for a monthly Bespoke Premium membership now!
Jan 29, 2018
While we don’t ever suggest that investors should base their trading solely on the calendar, there is evidence that the market and many stocks do indeed follow seasonal patterns. This makes our S&P 500 Stock Seasonality report a useful addition to every investor’s toolbox. Using the last ten years worth of price data, our Stock Seasonality report looks at the average returns for the S&P 500, its eleven sectors, and its 500 individual stocks. In the report, we highlight the five stocks in each sector that have historically been the best and worst performers over the next two weeks. For each stock, we also include information such as average returns, the percent of time each stock or sector is positive/outperforms the S&P 500, and its historical performance over the next two weeks for each of the last ten years. The Stock Seasonality report is published on a weekly basis on Mondays, and it is available to all Bespoke Premium and Bespoke Institutional subscribers.
One stock that we wanted to highlight this week is Cooper Companies (COO). While COO is by no means one of the most well-known stocks or among the top performing S&P 500 stocks during the upcoming two-week period, it has been remarkably consistent. As shown in the chart below, the stock has seen positive returns during the upcoming two-week period in each of the last ten years for an average gain of 5.3% (median: +3.6%). Besides COO, only two other stocks in the S&P 500 have managed positive returns during the upcoming two-week period in each of the last ten years.
What’s even more amazing about EA’s performance in the upcoming two-week period is that it has historically been only the third-best performing stock in the S&P 500 during this period!

For active traders, our Stock Seasonality report is an excellent tool to help keep track of the best and worst times of year for the overall market, sectors, and individual stocks. To see the report and which two stocks have performed even better than EA in the upcoming two-week period, sign up for a monthly Bespoke Premium membership now!
Jan 22, 2018
While we don’t ever suggest that investors should base their trading solely on the calendar, there is evidence that the market and many stocks do indeed follow seasonal patterns. This makes our S&P 500 Stock Seasonality report a useful addition to every investor’s toolbox. Using the last ten years worth of price data, our Stock Seasonality report looks at the average returns for the S&P 500, its eleven sectors, and its 500 individual stocks. In the report, we highlight the five stocks in each sector that have historically been the best and worst performers over the next two weeks. For each stock, we also include information such as average returns, the percent of time each stock or sector is positive/outperforms the S&P 500, and its historical performance over the next two weeks for each of the last ten years. The Stock Seasonality report is published on a weekly basis on Mondays, and it is available to all Bespoke Premium and Bespoke Institutional subscribers.
One stock that we wanted to highlight this week is Electronic Arts (EA). With a median gain of 7.77% and positive returns in eight of the last ten years, EA is a gamer’s paradise in the upcoming two-week period. So, what typically drives EA to such strong gains during this period? Earnings. EA typically reports earnings right towards the end of January, so its Q4 report is almost always covered in the span of the next two weeks. This year, EA report on 1/30 after the close, and given the stock’s track record, expectations will be high. If the company misses expectations, you can expect to see a reaction like the ones we saw during this period back in 2008 of 2016.
What’s even more amazing about EA’s performance in the upcoming two-week period is that it has historically been only the third-best performing stock in the S&P 500 during this period!
For active traders, our Stock Seasonality report is an excellent tool to help keep track of the best and worst times of year for the overall market, sectors, and individual stocks. To see the report and which two stocks have performed even better than EA in the upcoming two-week period, sign up for a monthly Bespoke Premium membership now!
Jan 16, 2018
While we don’t ever suggest that investors should base their trading solely on the calendar, there is evidence that the market and many stocks do indeed follow seasonal patterns. This makes our S&P 500 Stock Seasonality report a useful addition to every investor’s toolbox. Using the last ten years worth of price data, our Stock Seasonality report looks at the average returns for the S&P 500, its eleven sectors, and its 500 individual stocks. In the report, we highlight the five stocks in each sector that have historically been the best and worst performers over the next two weeks. For each stock, we also include information such as average returns, the percent of time each stock or sector is positive/outperforms the S&P 500, and its historical performance over the next two weeks for each of the last ten years. The Stock Seasonality report is published on a weekly basis on Mondays, and it is available to all Bespoke Premium and Bespoke Institutional subscribers.
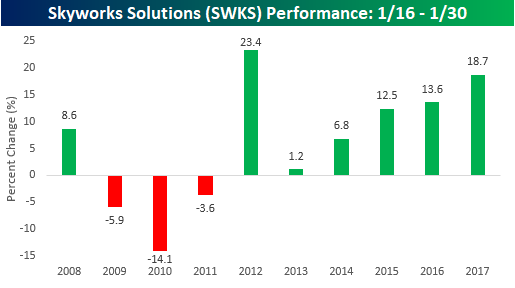
One stock that we wanted to highlight this week is Skyworks Solutions (SWKS). With a median gain of 7.7%, SWKS has been the second-best performing stock in the S&P 500 from the close on 1/16 through the close on 1/30 over the last ten years. It has also been positive during this period for six straight years, including three straight years where it has rallied over 10%. Can you guess what the best performing stock in the S&P 500 has been?
For active traders, our Stock Seasonality report is an excellent tool to help keep track of the best and worst times of year for the overall market, sectors, and individual stocks. To see the report, sign up for a monthly Bespoke Premium membership now!
Jan 8, 2018
While we don’t ever suggest that investors should base their trading solely on the calendar, there is evidence that the market and many stocks do indeed follow seasonal patterns. This makes our S&P 500 Stock Seasonality report a useful addition to every investor’s toolbox. Using the last ten years worth of price data, our Stock Seasonality report looks at the average returns for the S&P 500, its eleven sectors, and its 500 individual stocks. In the report, we highlight the five stocks in each sector that have historically been the best and worst performers over the next two weeks. For each stock, we also include information such as average returns, the percent of time each stock or sector is positive/outperforms the S&P 500, and its historical performance over the next two weeks for each of the last ten years. The Stock Seasonality report is published on a weekly basis on Mondays, and it is available to all Bespoke Premium and Bespoke Institutional subscribers.
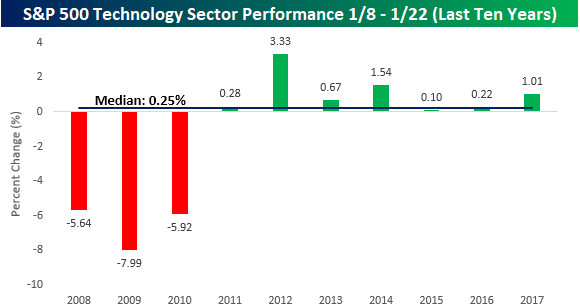
One sector that we wanted to highlight this week is Technology. While the sector’s median return during the upcoming two-week period has been a relatively muted 0.25%, one notable aspect of its performance has been the consistency of gains in recent years. As shown in the chart below, after three years where the sector was down sharply with declines of over 5% in a two-week period (2008, 2009, and 2010), everything has been coming up green for Technology for seven straight years!
For active traders, our Stock Seasonality report is an excellent tool to help keep track of the best and worst times of year for the overall market, sectors, and individual stocks. To see the report, sign up for a monthly Bespoke Premium membership now!
Jan 2, 2018
While we don’t ever suggest that investors should base their trading solely on the calendar, there is evidence that the market and many stocks do indeed follow seasonal patterns. This makes our S&P 500 Stock Seasonality report a useful addition to every investor’s toolbox. Using the last ten years worth of price data, our Stock Seasonality report looks at the average returns for the S&P 500, its eleven sectors, and its 500 individual stocks. In the report, we highlight the five stocks in each sector that have historically been the best and worst performers over the next two weeks. For each stock, we also include information such as average returns, the percent of time each stock or sector is positive/outperforms the S&P 500, and its historical performance over the next two weeks for each of the last ten years. The Stock Seasonality report is published on a weekly basis on Mondays, and it is available to all Bespoke Premium and Bespoke Institutional subscribers.
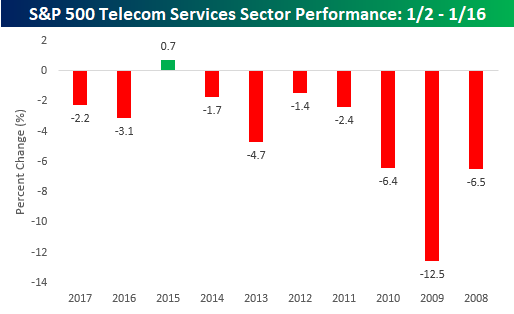
One sector that we wanted to highlight this week is Telecom Services. The table below shows the sector’s historical performance from the close on 1/2 through the close on 1/16 (when either of those two days occurs on a day the market is closed, we use the most recent closing price) over the last ten years. As shown, the upcoming two week period hasn’t been a good one for the sector. While it currently consists of just three stocks (AT&T- T, CenturyLink- CTL, and Verizon-VZ), the trend has been consistently lower. Over the last ten years, the sector’s median performance during this period has been a decline of 2.74% with declines in nine out of ten periods. The only year that the sector was up during this period was in 2015 and the gain was less than 1%,
For active traders, our Stock Seasonality report is an excellent tool to help keep track of the best and worst times of year for the overall market, sectors, and individual stocks. To see the report, sign up for a monthly Bespoke Premium membership now!