Jun 20, 2016
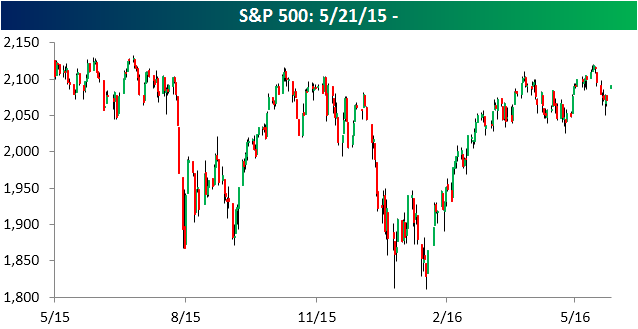
US futures are currently implying a positive gap opening of over 1% for the S&P 500. This would be the first upside gap of 1%+ for the index in more than four months (2/16/16) and the 13th since the S&P 500’s peak last May. Based on prior occurrences, should you buy or sell the opening rip in equities? In today’s Chart of the Day sent to paid subscribers, we analyzed the S&P 500’s performance from the open to close on prior occurrences where the S&P 500 gapped up 1% or more. To view the report, please start a 14-day free trial below.
Jun 17, 2016
This morning’s data on Housing Starts and Building Permits was a bit of a mixed bag, with little in the way of big changes on a month to month basis. On a y/y basis, though, total starts bounced nearly 10% while permits continued their downward trend, falling over 10% relative to last year.

In today’s Chart of the Day sent to paid subscribers, we analyzed the trend in Building Permits to see what it tells us about the broader economy. To view the report, please start a 14-day free trial below.
Jun 16, 2016
Everybody knows that banks have been under a world of hurt given the current ultra-low interest rate environment. Pull up a chart of any bank stock and the chart is the same; it starts at the upper left and ends at the lower right. The S&P 500 Bank Index looks the same, and from its high last year, it’s down 20%.

In today’s Chart of the Day sent to paid subscribers, we look at the performance of US Banks and how they compare to Banks in Europe in both absolute and relative terms. To view the report, please start a 14-day free trial below.
Jun 14, 2016
The UK’s FTSE 100 has fallen more than 1% for four consecutive trading days! This has taken the index close to three standard deviations below its 50-day moving average. In our trading range chart of the index below, you can see that the UK’s stock market hasn’t been this oversold since last December.
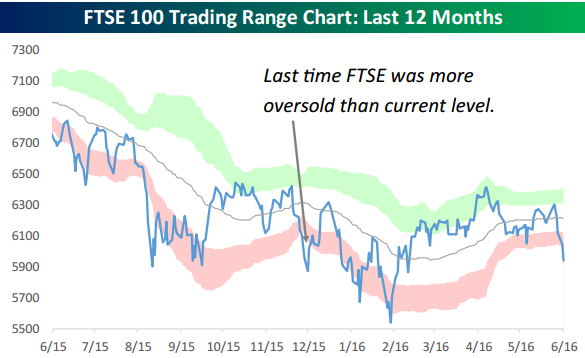
In today’s Chart of the Day sent to paid subscribers, we look at prior 4-day losing streaks for the FTSE 100 where the index fell more than 1% on each day. Does the index typically bounce back or continue lower? To view the report, please start a 14-day free trial below.
Jun 13, 2016
Below is a six-month chart of the VIX volatility index. As you can see, the VIX has surged over the past week, and it has broken above the top of a 3-month sideways range in the process.
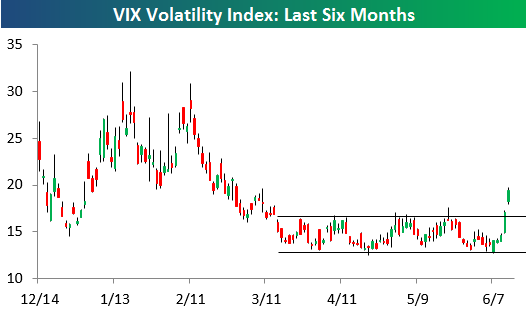
In today’s Chart of the Day sent to paid subscribers, we take a look at huge short-term spikes in the VIX and what it has historically meant for stocks in the coming days and weeks. To view the report, please start a 14-day free trial below.