Chart of the Day: Consistency of Buying
This content is for members onlyChart of the Day: Oil Bull Markets
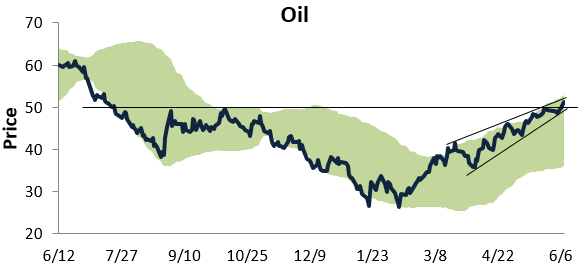
Below is a one-year price chart of oil, with the light green shading representing between two standard deviations above and below its 50-day moving average. As you can see in the chart, oil recently moved above resistance that had formed from its highs last September and October, and it continues to trade in a tight uptrend.
In today’s Chart of the Day sent to paid subscribers, we take a look at the huge run oil has had during its current bull market and how it compares to past oil bulls. To view the report, please start a 14-day free trial below.
Chart of the Day – 6/7/16: The Greenback Tide
This content is for members onlyChart of the Day: 6/6/16
This content is for members onlyChart of the Day – ISM Commodities Survey Surges
 In today’s ISM Services report, respondents noted increases in the prices for fifteen commodities and declines in just five. This follows Wednesday’s report for the manufacturing sector where eighteen commodities were up in price versus just one that was down. On a combined basis, thirty-three commodities were up in price in May and six were down, for a net of twenty-seven.
In today’s Chart of the Day, we look at how this month’s increase compares to recent and longer term history, and what impact (if any) it has on inflation.