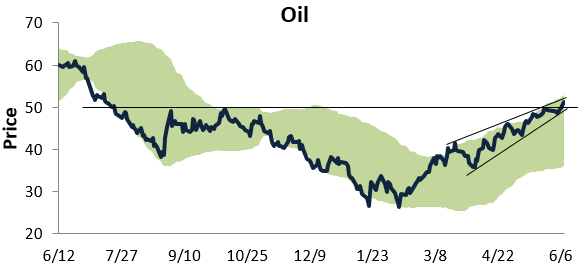
Below is a one-year price chart of oil, with the light green shading representing between two standard deviations above and below its 50-day moving average. As you can see in the chart, oil recently moved above resistance that had formed from its highs last September and October, and it continues to trade in a tight uptrend.
In today’s Chart of the Day sent to paid subscribers, we take a look at the huge run oil has had during its current bull market and how it compares to past oil bulls. To view the report, please start a 14-day free trial below.
