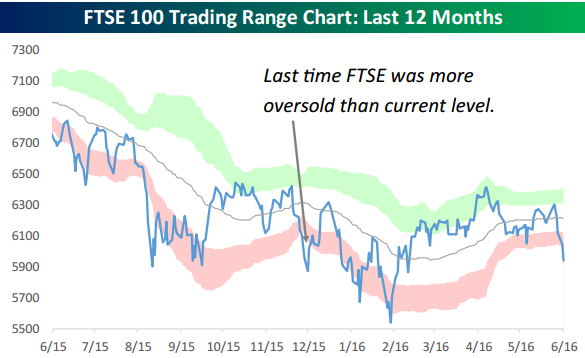
The UK’s FTSE 100 has fallen more than 1% for four consecutive trading days! This has taken the index close to three standard deviations below its 50-day moving average. In our trading range chart of the index below, you can see that the UK’s stock market hasn’t been this oversold since last December.
In today’s Chart of the Day sent to paid subscribers, we look at prior 4-day losing streaks for the FTSE 100 where the index fell more than 1% on each day. Does the index typically bounce back or continue lower? To view the report, please start a 14-day free trial below.
