Chart of the Day: Domestics vs. Internationals
This content is for members onlyChart of the Day: The Stock Market’s President
This content is for members onlyChart of the Day: Q2 Dash for Trash
This content is for members onlyChart of the Day: Top Stocks Under $10
Below is a table from our Top Stocks Under $10 report published back on May 11th. In today’s Chart of the Day sent to paid subscribers, we provide an update of that report and feature a bullish chart pattern for one of the names. To view the report (and see the original list of stocks), please start a 14-day free trial below.
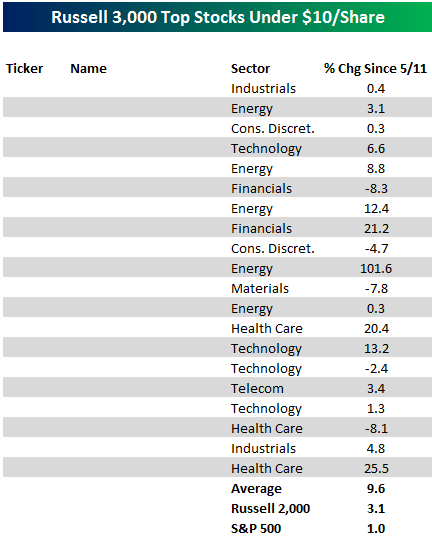
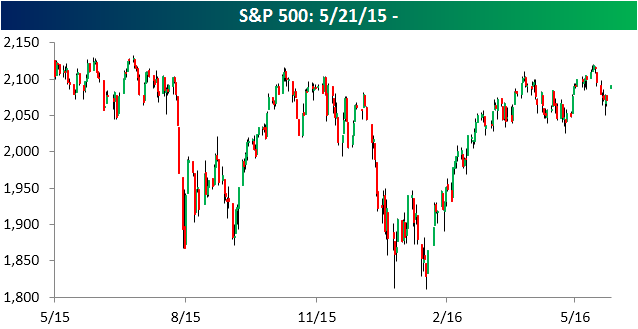
Chart of the Day – 2,100: Here We Go Again?
US futures are currently implying a positive gap opening of over 1% for the S&P 500. This would be the first upside gap of 1%+ for the index in more than four months (2/16/16) and the 13th since the S&P 500’s peak last May. Based on prior occurrences, should you buy or sell the opening rip in equities? In today’s Chart of the Day sent to paid subscribers, we analyzed the S&P 500’s performance from the open to close on prior occurrences where the S&P 500 gapped up 1% or more. To view the report, please start a 14-day free trial below.