Chart of the Day – Raytheon (RTN) Launches to Another High
This content is for members onlyChart of the Day: TLT Hits High Earth Orbit
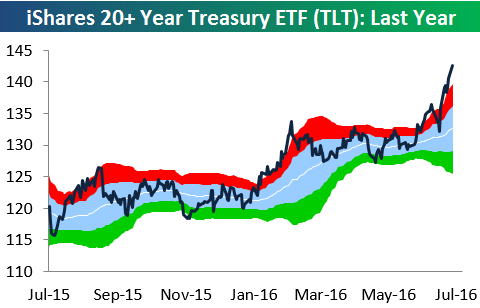
As long-dated Treasury yields continue to plummet, their prices have gotten extremely overbought. The ETF that tracks 20+Year Treasuries — TLT — is currently trading above $140/share, which is a new all-time high. At its current price, TLT is just under 3 standard deviations above its 50-day moving average. As shown below, that’s the most overbought it has been in at least a year:
In today’s Chart of the Day sent to paid subscribers, we highlight the near-term forward returns for TLT when it has gotten this overbought in the past. To view the report, please start a 14-day free trial below.
Chart of the Day – Chicago PMI Showing Post-Recessionary Trends
This content is for members onlyChart of the Day: Average Stock Returns Post Brexit: Domestics Win!
After a bloodbath in equities Friday and Monday, US stocks have come roaring back in the last two trading days to help stem some of the initial losses in the wake of Thursday’s UK referendum vote. Since the close on 6/23, the S&P 500 is now down just 2%, while the average return of the 500 stocks in the index is a bit worse at –2.91%. In today’s Chart of the Day, we take a look at the individual returns of the stocks in the S&P 500 including a look at what key traits are shared by the 20 biggest winners.