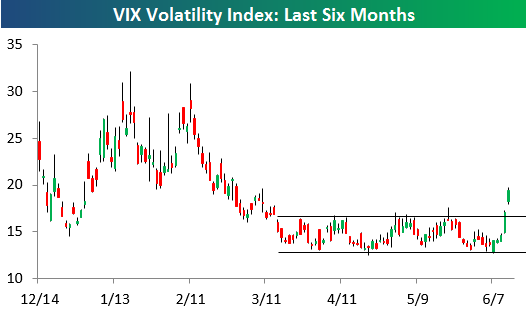
Below is a six-month chart of the VIX volatility index. As you can see, the VIX has surged over the past week, and it has broken above the top of a 3-month sideways range in the process.
In today’s Chart of the Day sent to paid subscribers, we take a look at huge short-term spikes in the VIX and what it has historically meant for stocks in the coming days and weeks. To view the report, please start a 14-day free trial below.
