Jul 18, 2016
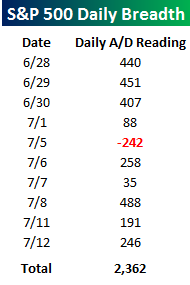 As we have highlighted in prior reports, by a number of measures the ten-day rally that followed the two-day sell-off following the Brexit vote was right up there with the strongest rallies on record. Not only was the rally in the S&P 500 extremely impressive, but breadth was nothing to sneeze at either. The table to the right shows the S&P 500’s daily Advance/Decline reading during that 10-day run. As shown, there were four different days where the S&P 500 had a daily breadth reading of +400 or more. That doesn’t happen very often! Over the entire 10-day span, the S&P 500’s 10-day A/D reading reached an unheard of +2,362.
Earlier today, we sent an analysis of the market’s performance following prior extreme moves in short-term breadth to Bespoke Premium and Bespoke Institutional members. The list contains some interesting insights in how the market has performed following prior periods as well as how trends in breadth have changed over time. This one is can’t miss!
See the full B.I.G. Tips report by signing up for a monthly Bespoke Premium membership now. Click this link for a 10% discount ($89/month).
Jul 13, 2016
On January 22, we distributed a B.I.G. Tips report to our paid subscribers called, “WWPED (What Would Private Equity Do?” In that report, we looked through the carnage in equity markets to find beaten down value names that could be attractive targets to the private equity world. We noted that while private equity firms can have widely divergent strategies, they often look for some key characteristics: under-performing companies and significant free cash flow potential. Using that as a guide, we sorted through the Russell 1,000 for companies that were then trading at 10x or less on a “TEV / (EBITDA – Capex)” basis, which is a good proxy for valuation relative to cash flow. We found 39 names that met our criteria and highlighted three in particular (URBN, GNC and GMRE) in that report.
Yesterday, we updated that screen and sent it to Bespoke Premium and Bespoke Institutional members. The updated report looks at the performance of our original WWPED list of stocks and identified some new stock ideas after updating the screen for current market pricing. To get the full report, please sign up for a paid membership below!
See the full B.I.G. Tips report by signing up for a monthly Bespoke Premium membership now. Click this link for a 10% discount ($89/month).
Jul 12, 2016
Back on June 28th, we published a B.I.G. Tips report (clients only) looking at the extent of the two-day sell off following the Brexit vote and how it had reached historic levels on a short-term basis. In that report, we provided an analysis of how the S&P 500 performed following prior periods of extreme oversold readings and noted that forward returns were positive. While the magnitude of the positive returns we highlighted was not as strong as what we have seen in the last two weeks, the direction was the same.
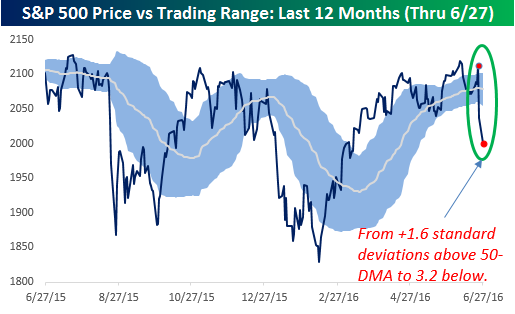
 One chart we included from that report on 6/28 showed the S&P 500’s trading range as measured by standard deviations that the index was closing above or below its 50-day moving average (DMA). For reference, anything within one standard deviation is considered a ‘normal’ level, while anything more than one standard deviation above (below) is considered overbought (oversold). The chart showed that the S&P 500 went from 1.6 standard deviations above its 50-DMA to 3.2 standard deviations below in the span of two trading days. In the history of the index dating back to 1928, that was the most extreme two-day move on record.
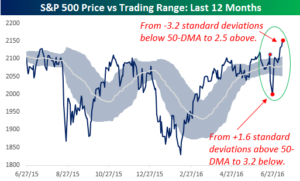 So what has happened since then? The second chart to the right is updated through 7/12. In the ten trading days since then, the S&P 500 has gone from 3.2 standard deviations below its 50-DMA to 2.5 standard deviations above.
We just sent out a B.I.G. Tips report to Bespoke Premium and Bespoke Institutional members, which provided an analysis of prior periods where the S&P 500 saw similar shifts from extreme oversold to extreme overbought and how equities performed going forward. To get the full report, sign up.
See the full B.I.G. Tips report by signing up for a monthly Bespoke Premium membership now. Click this link for a 10% discount ($89/month).
Jul 11, 2016
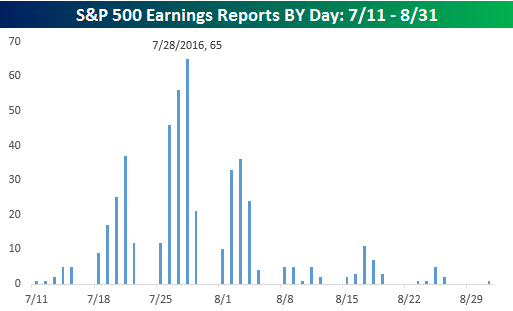 Earlier today, we posted a look at the number of companies set to report earnings by day during the upcoming earnings season, along with which stocks tend to exhibit the most volatility when they report earnings. The chart to the right shows a similar look at the pace of earnings for the upcoming reporting period but just includes S&P 500 names. Looking at how reports are spread out, the pace won’t really pick up until the middle of next week as you have to wait until 7/19 until more than ten S&P 500 companies report on the same day. The peak day for earnings among S&P 500 stocks is still 17 days away on 7/28 when 65 companies will report.
Earlier today, we also sent out a B.I.G. Tips report to Bespoke Premium and Bespoke Institutional members, which contained a preview of the upcoming earnings season and what we can expect based on analyst sentiment heading into the period. To get the full report, sign up.
See the full B.I.G. Tips report by signing up for a monthly Bespoke Premium membership now. Click this link for a 10% discount ($89/month).