Jul 8, 2016
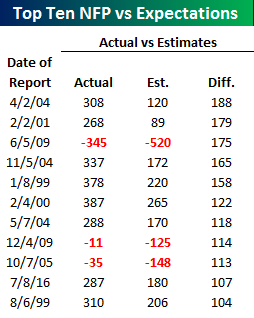 After an abysmal headline Non-Farm Payrolls (NFP) report for May, June saw a complete 180-degree turn with this morning’s reported reading for total non-farm payrolls coming in at 287K compared to expectations for a gain of 180K. That beat of 107K qualifies as the best headline print relative to expectations since December 2009 (November 2009 report), and based on our Economic Indicator Database, the 10th best report relative to expectations since 1998. The table to the right lists each of the ten prior NFP reports where the initial print exceeded consensus estimates by the widest margin.
In a B.I.G. Tips report just sent to Bespoke Premium and Bespoke Institutional members, we provided an analysis of the S&P 500’s performance on each of these prior ten days. Read the full report by signing up.
See the full B.I.G. Tips report by signing up for a monthly Bespoke Premium membership now. Click this link for a 10% discount ($89/month).
Jul 7, 2016
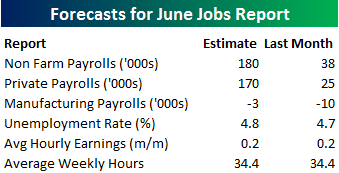
Heading into tomorrow’s Non Farm Payrolls (NFP) report for June, economists are expecting an increase in payrolls of 180K, which would be a big increase from last month’s extremely disappointing level of 38K. In the private sector, economists are expecting an increase of 170K, which would be a similar improvement to what economists are forecasting for the overall NFP reading. The unemployment rate is forecasted to increase back up to 4.8% from 4.7% last month. Growth in average hourly earnings is expected to remain unchanged at 0.2%, while hours worked is forecast to remain unchanged at 34.4. May’s employment report was a big disappointment for the market and economists, but economists are generally considering it to be a one month blip.
In a report sent to Bespoke Premium and Bespoke Institutional clients today, we provided the historical performance of the S&P 500, sectors, individual stocks on the day of NFP reports over the last two years. To see the report, please sign up for a monthly Bespoke Premium membership below!
See the full B.I.G. Tips report by signing up for a monthly Bespoke Premium membership now. Click this link for a 10% discount ($89/month).
Jun 28, 2016
The results of the UK referendum last Thursday really caught the market leaning in the wrong direction and going forward a massive fog of uncertainty looms over the market regarding how the entire drama will transpire. Over the weekend, we published a flowchart detailing some of the possibilities regarding how things could play out, but even this complicated web of scenarios doesn’t take into account all of the unknown secondary and tertiary effects. Absolutely nobody knows how, when, and on what terms the UK and EU will work things out. It is just going to take time.
With the understanding that the path forward is murky, we compared the two-day sell-off in equities on Friday and Monday to prior periods in history to get a sense of perspective of where things stand and how the market has reacted in the past. For starters, while the decline in US equities has been sharp, it doesn’t even compare to some of the currency adjusted returns European stocks have weathered. For instance, in many major European benchmarks, stocks dropped more in two days than they have in all but the most extreme two-day periods of the last 30 years. In a B.I.G. Tips report just sent to Bespoke Premium and Bespoke Institutional members, we put the magnitude of the declines Friday and Monday into perspective relative to other steep two-day declines in history. Read the full report by signing up.
See the full B.I.G. Tips report by signing up for a monthly Bespoke Premium membership now. Click this link for a 10% discount ($89/month).
Jun 26, 2016
With Brexit dealing shockwaves around global markets Friday and a wave of political recriminations working their way through UK politics, we took the time to sketch out a flow chart of “what’s next” in the process of the UK leaving the EU. It’s extremely complicated, but in a B.I.G. Tips report just sent to Bespoke Premium and Bespoke Institutional members, we outline the basic range of outcomes possible and what needs to happen to get there. Read the full report by signing up.
See the full B.I.G. Tips report by signing up for a monthly Bespoke Premium membership now. Click this link for a 10% discount ($89/month).
Jun 24, 2016
It’s hard to imagine a time when there has been such a transformational shift in sentiment in the span of less than a day. Heading into the close yesterday, equities surged on optimism that the Remain camp would come out on top in the UK referendum. As the polls started coming in, though, it became clear that Brexit would come out on top. So, after closing within 1% of an all-time high on Thursday, the S&P 500 fell over 3% today, and compared to the rest of the world, we got off easy!
Today’s decline marks only the sixth time in the S&P’s history that the index closed within 1% of an all-time high on one day, but then closed down over 3% the next. In a B.I.G. Tips report just sent to Bespoke Premium and Bespoke Institutional members, we detail the historical reaction following prior occurrences where the S&P 500 fell so much while trading so close to an all-time high. Read the full report by signing up.
See the full B.I.G. Tips report by signing up for a monthly Bespoke Premium membership now. Click this link for a 10% discount ($89/month).