Back on June 28th, we published a B.I.G. Tips report (clients only) looking at the extent of the two-day sell off following the Brexit vote and how it had reached historic levels on a short-term basis. In that report, we provided an analysis of how the S&P 500 performed following prior periods of extreme oversold readings and noted that forward returns were positive. While the magnitude of the positive returns we highlighted was not as strong as what we have seen in the last two weeks, the direction was the same.
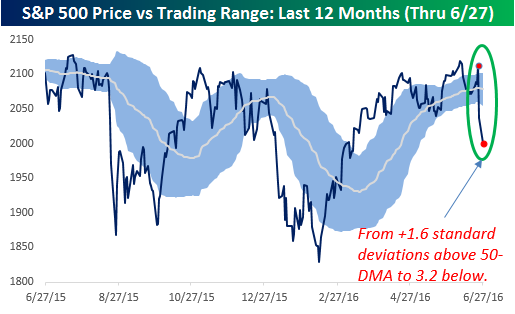 One chart we included from that report on 6/28 showed the S&P 500’s trading range as measured by standard deviations that the index was closing above or below its 50-day moving average (DMA). For reference, anything within one standard deviation is considered a ‘normal’ level, while anything more than one standard deviation above (below) is considered overbought (oversold). The chart showed that the S&P 500 went from 1.6 standard deviations above its 50-DMA to 3.2 standard deviations below in the span of two trading days. In the history of the index dating back to 1928, that was the most extreme two-day move on record.
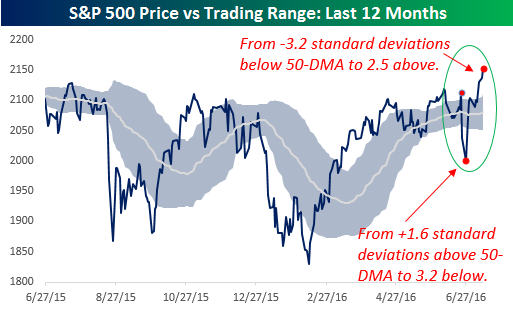 So what has happened since then? The second chart to the right is updated through 7/12. In the ten trading days since then, the S&P 500 has gone from 3.2 standard deviations below its 50-DMA to 2.5 standard deviations above.
We just sent out a B.I.G. Tips report to Bespoke Premium and Bespoke Institutional members, which provided an analysis of prior periods where the S&P 500 saw similar shifts from extreme oversold to extreme overbought and how equities performed going forward. To get the full report, sign up.
See the full B.I.G. Tips report by signing up for a monthly Bespoke Premium membership now. Click this link for a 10% discount ($89/month).
