Jul 21, 2022
Tacking on to the list of weaker than expected US economic releases this morning was a big drop in the Philadelphia Fed’s Manufacturing Business Outlook Survey. After a contractionary -3.3 reading last month, forecasts were calling for the headline number to rise back into expansion. Instead, it posted an even larger decline down to -12.3; the lowest reading since May 2020. Expectations have been even worse. That month-over-month decline in July ranked in the bottom decile of all monthly moves in the history of the survey dating back to 1968. Even more depressing, the low level reached is the worst reading since December 1979.

Given the huge drop in the headline index, breadth left much to be desired this month. The categories are almost evenly split between those in contraction and expansion while there is also a wide dispersion between where each category stands relative to their respective ranges. For example, while New Orders has become very depressed – only in the 3rd percentile of all months after the double digit month over month decline in July – the index for Number of Employees has held up relatively well in the 93rd percentile. The whole of the report paints a fairly dour outlook for the region’s manufacturing economy, but expectations are broadly weaker than current conditions with multiple categories reaching new record lows.

As previously mentioned, New Orders is the weakest current conditions index. The reading fell from -12.4 to -24.8 in the past month. Prior to the spring of 2020, the last time this index was as low was during the Global Financial Crisis era. Expectations are even worse. Last month’s decline was much more severe at 23.5 points versus 5 points in July, however, the continued drop has brought the index to the lowest level since September 1979. Although demand has slumped, Shipments actually accelerated with the current conditions index slightly below median while expectations saw a large 9.2 point MoM jump. Unfilled Orders expectations similarly moved higher versus last month but that was only a more modest bounce as the index remains in the bottom 1% of all months. Current Conditions are more modestly in contraction in the 27th percentile after falling another 3.4 points in July.

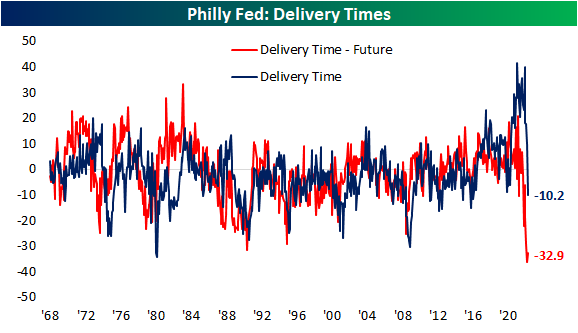
One of the most striking changes over the past few months has been in regards to supply chains. Higher readings in the Delivery Times index indicate that manufacturers are seeing products taking longer to reach their destinations and vice versa for lower readings. Throughout the pandemic, this index sat at unprecedentedly high levels. All of that has been reversed now, though, as Delivery Times moved from expansion into contraction. Not only are delivery times now falling, but the July reading was the lowest reading since May 2016. In other words, on net, a larger share of respondents are seeing declines rather than increases in how long it takes for products to be delivered. Meanwhile, expectations are at the extreme low end of their historical range, coming slightly off last month’s record low. All that is to say supply chains are seeing massive improvements to stress as demand rapidly cools.
Prices have also been experiencing a sharp reversal with Prices Paid at the lowest level since January of last year and Prices Received at the lowest level since last March. Click here to learn more about Bespoke’s premium stock market research service.

Jul 21, 2022
Last week, over a quarter of respondents to the AAII sentiment survey reported bullish sentiment for the first time in over a month. As the S&P 500 has made a considerable move to the upside, bulls have continued to come back this week rising to 29.6%. The percentage of respondents reporting as optimistic has now come back within one standard deviation of its historical average and is at the highest level since the first week of June.
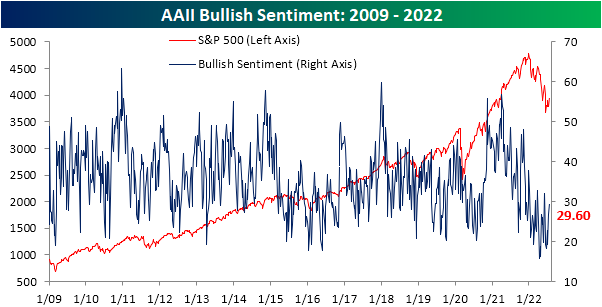
Bearish sentiment has fallen in lockstep with the increase in bullish sentiment. After coming in at over 50% two weeks ago, the reading has shed 10.6 percentage points. Albeit improved, bearish sentiment remains well above the historical average and the double-digit two-week decline is actually the seventh of the year. In other words, the sharp drop in bearish sentiment is not exactly unusual compared to other moves this year as it still has further to go until it reaches a more “normal” level.

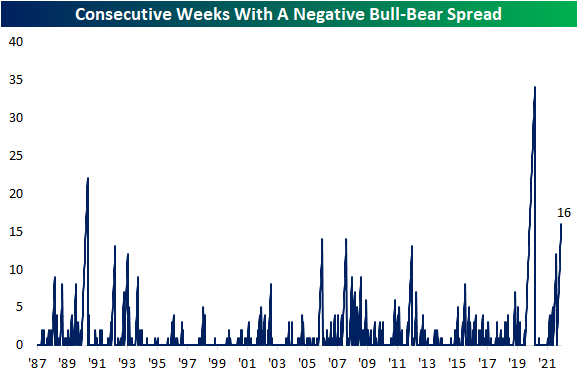
Regardless, with inverse moves in bulls and bears the bull-bear spread has risen to -12.6. That is the highest reading since the first week of June and, as shown in the second chart below, the 16th consecutive week with bears outnumbering bulls. Clearing two other streaks from the early 2000s, that is now the third longest streak on record behind the 22 and 34-week-long streaks ending in December 1990 and October 2020, respectively.

Not all of the losses to bears went to bulls. Neutral sentiment also rose this week rising to 28.2% from 26.6% last week. That is the highest level in three weeks as neutral sentiment has generally been less volatile than bulls and bears recently. Click here to learn more about Bespoke’s premium stock market research service.

Jul 21, 2022
Jobless claims have undergone further deterioration in the latest week’s data as the seasonally adjusted number topped 250K for the first time since November, and it has now been over four months since the cycle low. As we discussed in a B.I.G. Tips report earlier, that streak without a new low in claims is not particularly long from a historical standpoint, but it is notable when taking into account past increases in claims prior to recessions. While last week’s reading went unrevised, this week’s reading rose 7K to 251K which is 85K above the early April low.

On a non-seasonally adjusted basis, claims were also higher rising 7.9K to 249K. As we have frequently noted, while adjusting for seasonality claims have reversed trend and have been moving higher during a time of year when they typically rise. Historically, last week would have marked the high, although, that has not always been the case. For example, in 2010 and 2011, and potentially again this year, the seasonal high came during the current week of the year instead. In other words, the continued move higher in claims this week on a non-seasonally adjusted basis is somewhat unusual but not without precedent. While that increase could be on account of residual seasonality, it is hard to parse if it is also potentially on account of the material worsening in claims.

Delayed an additional week to the initial claims number, seasonally adjusted continuing claims jumped 51K this week. While that is not exactly a massive jump, bringing claims only to the highest level since April, the week-over-week increase was the largest uptick since late November.

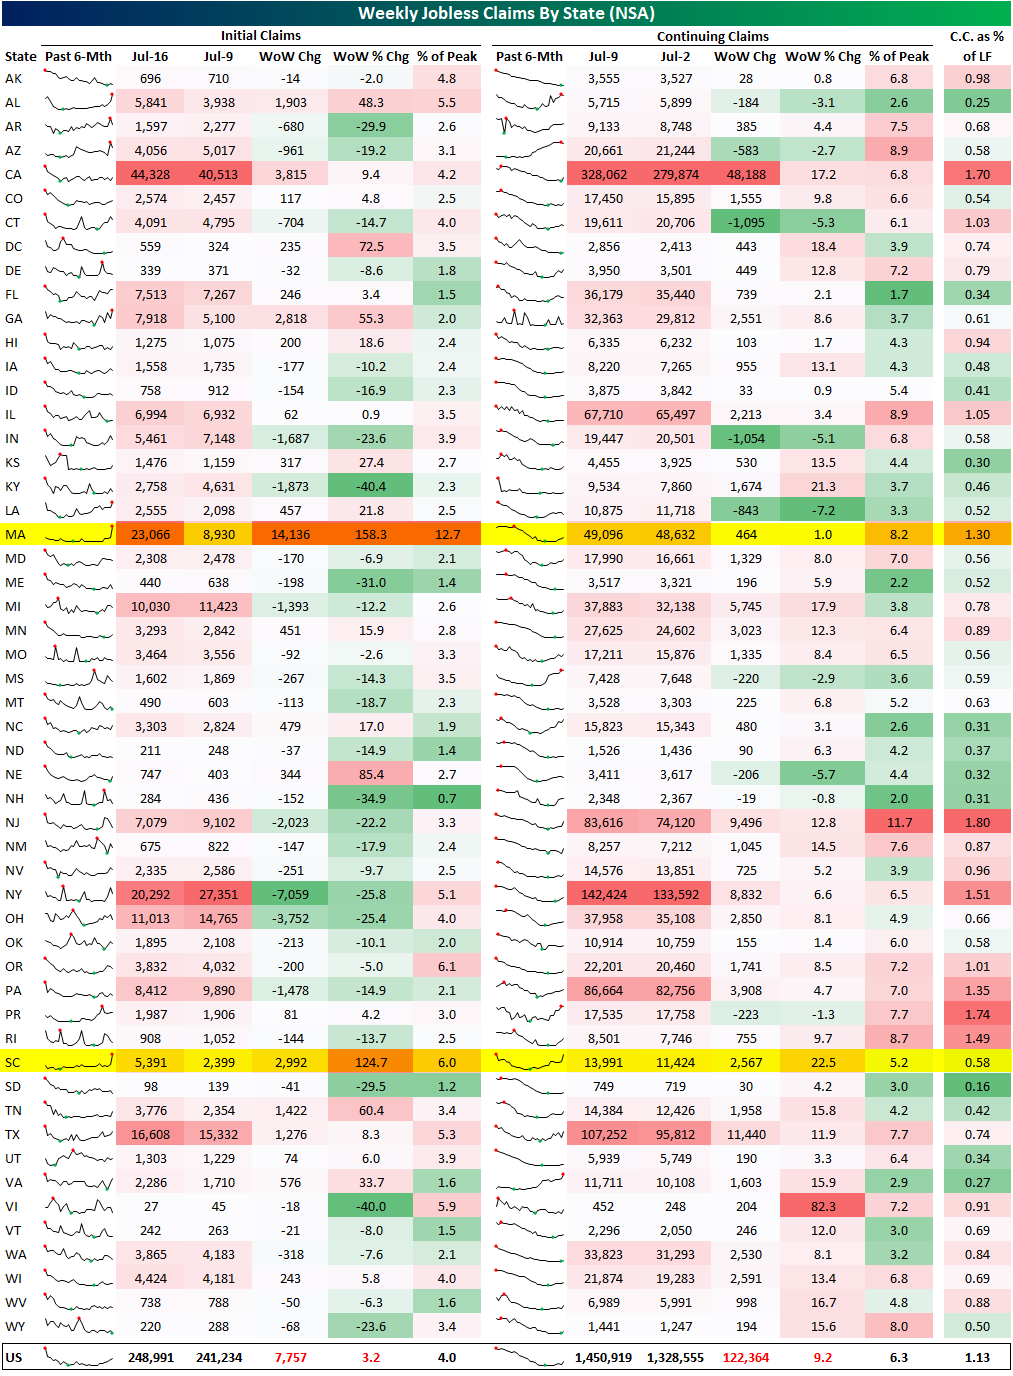
Below we provide a state-level breakdown of the initial and continuing claims numbers (both non-seasonally adjusted). While there are likely some seasonal factors playing into week-to-week movements, this week there were two unusual moves weighing on the national number. Whereas the net national move in claims was an increase of 7.8K, Massachusetts saw a move nearly double the size of that national change. That state’s initial claims went from under 9K all the way up to 23K; the ninth largest weekly increase on record going back to 1986. While less remarkable of a move but also ranking in the top decile of all periods, South Carolina also saw a peculiar increase with claims more than doubling. While these readings could very well be genuine, we would caution that given their outlier nature, a revision down the road is possible, and that would make this week’s release look somewhat better after revisions than it does today. That being said, revisions likely would not be enough to alter the overall national trend in recent months. Click here to learn more about Bespoke’s premium stock market research service.
Jul 20, 2022
Log-in here if you’re a member with access to the Closer.
Looking for deeper insight into markets? In tonight’s Closer sent to Bespoke Institutional clients, we start out with an overview of Tesla (TSLA) earnings as well as the United Airlines (UAL), CSX (CSX), and Las Vegas Sands (LVS) earnings (page 1). We then provide an update on the rapid narrowing of credit spreads (page 2) and the changing dynamics of growth relative to value (page 3). After a recap of today’s historic 20 year bond reopening (page 4), we go over existing home sales (Page 5 and 6) before closing out with an update of the latest EIA stockpile data (page 7).

See today’s full post-market Closer and everything else Bespoke publishes by starting a 14-day trial to Bespoke Institutional today!