Aug 31, 2022
The end of August is here and US equities, as measured by the S&P 500 ETF (SPY), have been on a wild ride. At the mid-month high, SPY was sitting on a 4.3% month-to-date gain, but that has more than entirely been erased as it is on pace to finish the month down closer to 3.5%. The country ETF of each other major global economy that we track in our Global Macro Dashboard is a similar story. Across these countries, on average, they had reached a 3.13% gain at their month-to-date highs, but today they are down an average of 3.5% MTD. Overall, developed markets have faired much worse than emerging market countries with average declines of 4.82% versus 1.24%, respectively. In fact, there are only two ETFs—Brazil (EWZ) and India (INDA)—that are currently positive for the month. Meanwhile, China (MCHI) is unchanged. On the other end of the spectrum, Sweden (EWD) has been the worst performer nearing an 11% decline with a number of other European nations following up with the next worst performance.
With stock markets around the world giving up the ghost in August, most have moved back below their 50-DMAs or even into oversold territory. There are no country ETFs more than one standard deviation above their moving averages although EWZ and INDA have only moved out of overbought territory in the past week.

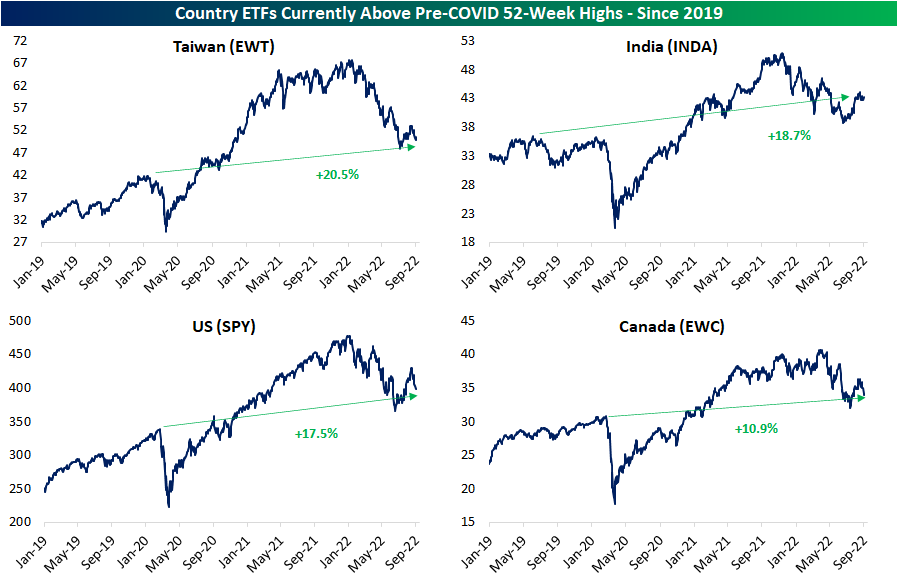
As we show in the table above, this year’s declines have resulted in the average country ETF falling 24% below its 52-week high. Those declines bring the vast majority of these countries back below pre-COVID highs as well. At the moment, there are only four countries that remain above pre-COVID 52-week highs: Taiwan (EWT), India (INDA), the United States (SPY), and Canada (EWC). This exclusive group would need to fall substantially further to revert back to those prior highs, and as shown in the chart below, each one would also still have support at lows from earlier this year before pre-COVID highs become a technical level worth eying. Click here to learn more about Bespoke’s premium stock market research service.
Aug 30, 2022
Log-in here if you’re a member with access to the Closer.
Looking for deeper insight into markets? In tonight’s Closer sent to Bespoke Institutional clients, we start out tonight with a breakdown of the forward multiples of Russell 1,000 stocks and how much the index would need to decline to reach certain multiples (page 1). We then provide a decile breakdown of performance since the August 16th high (page 2). Turning to macro data, we dive into today’s JOLTS data (page 3) and rent and home prices (page 4).

See today’s full post-market Closer and everything else Bespoke publishes by starting a 14-day trial to Bespoke Institutional today!
Aug 30, 2022
Given the market cap weighted methodology of the index, the S&P 500 receives outsized impacts from the largest stocks making mega caps like Apple (AAPL) or Amazon (AMZN) a critical group to look at. The FANG+ index which tracks some of the largest and most highly traded tech giants helps to provide a glimpse at the performance of said mega caps. On a relative basis versus the S&P 500, the NYSE’s FANG+ index has been trending lower since last November around the time of the peak of the growth/Tech trade, but it peaked even further back in early 2021. The relative strength line then hit a low in the late spring of this year and has been on the move higher alongside the S&P 500 ever since. In the past few weeks, however, the line has begun to roll over moving in line with that downtrend.
One important factor to note about the FANG+ Index is the membership of two Chinese mega-cap stocks: Baidu (BIDU) and Alibaba (BABA). Given the past year and a half’s news slate regarding the potential delisting of Chinese stocks on US equity markets, these two names are in a different boat than the rest of the FANG+ cohort, and that has been reflected in price action. Put differently, the FANG+ index is a good, but far from perfect, proxy for mega caps because of the inclusion of Chinese names which face exogenous risks that do not apply to US-based mega-caps. Excluding those two, the FANG+ index’s relative strength line versus the S&P 500 peaked far later in late 2021, and the recent turn lower has been a more concrete rejection of a breakout from the recent downtrend.

While delisting risk has generally plagued BABA and BIDU for more than a year leaving them 70% and 58% below all-time highs, respectively, at least in the short term there has been some relief. Headlines out late last week reported the signing of a cooperative agreement for auditing these companies resulting in a lower—but still real—probability of delisting. As a result, BIDU and BABA have left their peers behind as the only two FANG+ members in the green since the broader market’s August 16th high. For BIDU, that positive performance so far has held in spite of a weak reaction to earnings Tuesday as well. In other words, positive news for Chinese members of the FANG+ stocks has helped to mask a degree of the weakness of one of the more important indicators of broader market health. Click here to learn more about Bespoke’s premium stock market research service.
