Sep 1, 2022
In the wake of Jackson Hole and more hawkish than previously expected Fedspeak, the S&P 500 is on pace for its worst week since June. As a result, recent improvements in investor optimism have been entirely given back. The AAII survey of individual investors saw only 21.9% of respondents report as bullish this week. That is the worst reading in two months as the back-to-back declines over the past two weeks total 11.4 percentage points.

That was matched with a considerable increase in bearish responses. For the first time since early July, over half of respondents reported a pessimistic outlook for equities. Bearish sentiment’s eight percentage point week-over-week increase was the largest since mid-June and the third weekly increase in a row.
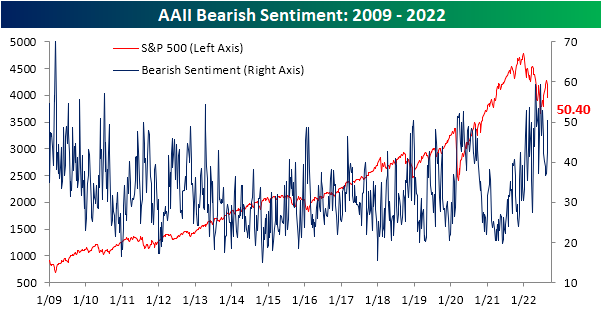
The inverse moves of bullish and bearish sentiment resulted in the bull-bear spread to quickly move down to the worst level since the start of July. That follows a string of readings only a couple of weeks ago in which bears outnumbered bulls by only single digits.

Given the reversal in the spread, the streak of negative readings presses on. Now at 22 weeks long, it ties the 1990 streak for the second longest on record.

The AAII survey was not alone in showcasing a much more pessimistic tone of investors. Both the NAAIM Exposure Index and the Investors Intelligence survey also pivoted to more bearish readings. Combining these three results, the average reading on sentiment has fallen back to more than one standard deviation below the historical norm. Although that is not as pessimistic of an aggregate sentiment reading as earlier this year, there have only been a handful of other times going back to the mid-2000s in which the investment community had as negative of an outlook towards the equity market. Click here to learn more about Bespoke’s premium stock market research service.

Sep 1, 2022
Please click the image below to view our September 2022 market calendar. This calendar includes the S&P 500’s average percentage change and average intraday chart pattern for each trading day during the upcoming month. It also includes market holidays and options expiration dates plus the dates of key economic indicator releases. Click here to view Bespoke’s premium membership options.

Sep 1, 2022
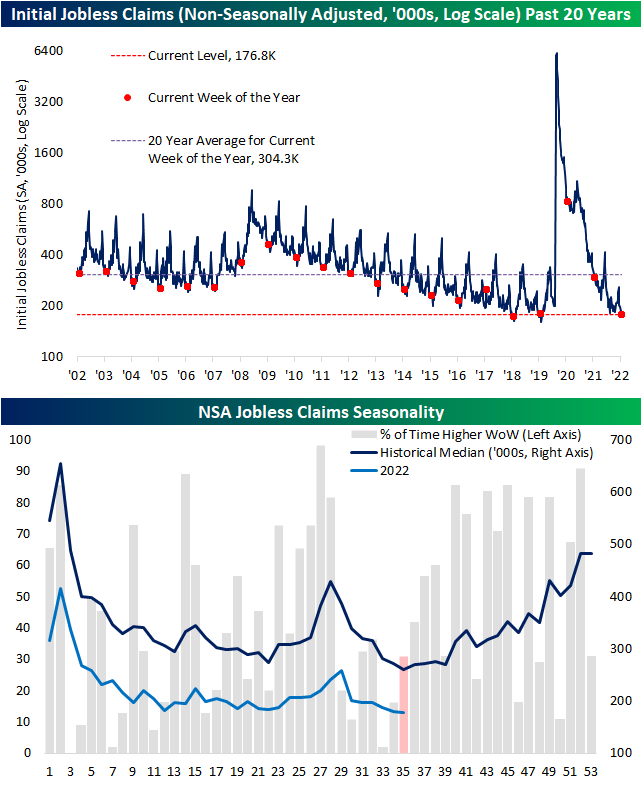
Initial jobless claims had a strong showing this week as the previous reading was revised lower by 6K to 237K. From that revised level, claims fell another 5K down to 232K marking the lowest reading since the last week of June. That was also handily below expectations which were calling for an increase up to 248K. With another week over week decline, claims have now fallen for three weeks in a row; the longest streak of declines since February.

On a non-seasonally adjusted (NSA) basis, the current week of the year has historically marked the annual low. Assuming that is the case this year, 176.8K is in line with the readings from the comparable week of the year in 2018 and 2019. Although further declines are not out of the realm of possibility, assuming normal seasonal patterns, NSA claims will likely rise from here through the end of the year.
Continuing claims are lagged an additional week to initial claims.. While continuing claims remain low having avoided the same degree of upward drift that initial claims have experienced this year, this week’s reading did move up to 1.438 million. That marks the most elevated level since the first week of April.
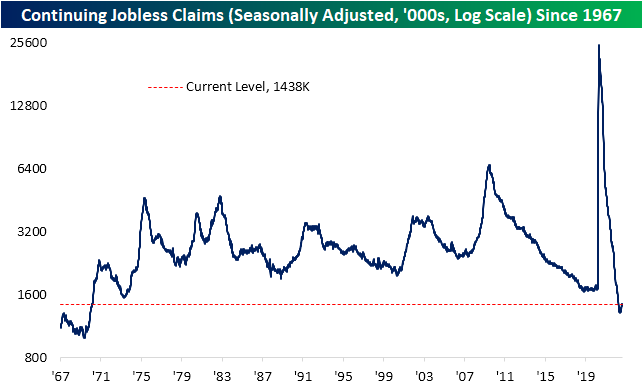
Recently we have been highlighting the ratio of initial claims to continuing claims as a way of showing the disconnect between the two seasonally adjusted readings. In other words, the lack of filter through of initial claims into continuing claims, which can be extrapolated as those filing for unemployment are quickly finding new roles. Although the ratio remains well above the historical norm and especially the range of readings observed since the early 1990s, it has begun to roll over in the past five weeks. As for just how big of a drop it has been, the decline ranks in the bottom 2% of all 5-week moves on record. While that is not to say the overall claims picture (initial claims not turning into continuing claims) has completely turned around, it is a sign that continuing claims have been playing a degree of catch-up. Click here to learn more about Bespoke’s premium stock market research service.

Aug 31, 2022
Log-in here if you’re a member with access to the Closer.
Looking for deeper insight into markets? In tonight’s Closer sent to Bespoke Institutional clients, we start out with some commentary on Fedspeak, real yields versus forward multiples, and today’s ADP release (page 1). Next, we dive into the Canadian GDP print (page 2) followed by a look at petroleum stockpiles and production viewed through monthly and weekly EIA data (pages 3 and 4).

See today’s full post-market Closer and everything else Bespoke publishes by starting a 14-day trial to Bespoke Institutional today!