Sep 4, 2022
It’s the unofficial end of summer with Labor Day now here. While that may mean summer vacation for many traders is over, historically, the holiday-shortened week has averaged uninspired performance. Over the course of the entire week (from the close of the Friday before the holiday to the close of the following Friday), the S&P 500 averaged a modest decline of 0.13% with positive performance only half the time during the post-WWII period. However, breaking down the years by whether or not the S&P 500 was higher or lower on a year to date basis shows a more nuanced story.
Years in which the index was up year to date heading into the holiday have tended to see modest further gains that week. Tuesday has typically been the best day of the week with a 15 bps move higher. On the other hand, years when the S&P 500 was lower YTD have been far worse. The Tuesday after Labor Day has nearly averaged a full 1% decline with positive performance just 40% of the time. That average is somewhat skewed by a 9.9% drop the lady after Labor Day in 1946, but even still, the median decline has been 0.50%. Thursday and Friday have similarly averaged declines albeit much smaller in size.

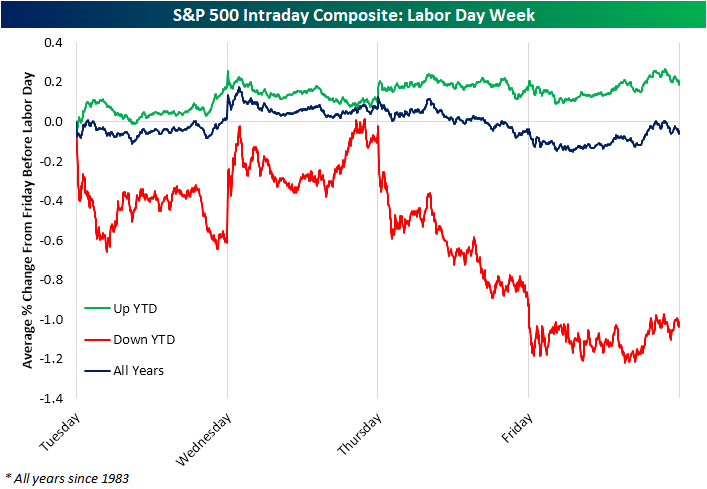
Looking at the intraday pattern going back to the start of our data in 1983, the bulk of the decline came from midweek on. As shown in the intraday composite below, the S&P 500 has on average almost turned positive by Wednesday’s close, but on Thursday and Friday it has tended to face heavy selling pressures. The series for the years when the S&P 500 was down YTD looks a lot more extreme than the one for years when it was up YTD, but that’s because of the relatively small sample size (just eight years since 1983). In those eight years, though, the S&P 500 was only up the day after Labor Day twice (1990 and 2015). Buckle up! Click here to learn more about Bespoke’s premium stock market research service.
Sep 3, 2022
As we noted in a post on Thursday, the latest data from the weekly AAII survey showed bearish sentiment cross back above 50% while bullish sentiment is back below 25%. With further pessimistic readings, this year is on pace to be one of the worst years on record for investor sentiment as measured by that survey. Below we show the average reading for bullish and bearish sentiment by year as well as how many weeks during each year those readings were below 25% and above 50%, respectively. In a nutshell, 2022 has been a year popular with the bears.
With bullish sentiment having averaged a reading of only 24.22% in 2022, it is below the previous runner-up and record low of 27.29% and 27.08% in 1988 and 1990. That low average is thanks to twenty weeks so far this year where bullish sentiment has been below 25%. With four months to go in the year, this year would only need to see one more month with such a reading in order for 2022 to become the year that most often saw less than a quarter of respondents report as bullish.
Conversely for bearish sentiment, 2022 has averaged a reading of 45.87%, slightly above the previous record of 45.2% from 2008. Slightly different from bullish sentiment, however, by the end of the year there will need to be almost two more months of bearish sentiment readings above 50% to take out the 2008 record. Currently, this year is closing in on 1990 when there were 13 weeks in which over half of respondents reported pessimistic sentiment. Click here to learn more about Bespoke’s premium stock market research service.

Sep 2, 2022
Bespoke’s Crypto Report contains numerous technical, momentum, and sentiment charts for bitcoin, ethereum, and other key cryptos. Page 1 of the report includes our weekly commentary on the space and attempts to identify any new trends that are emerging. The remaining pages include important overbought/oversold levels to watch, charts on historical drawdowns and rallies, seasonality trends, futures positioning data, Google search trend shifts, and more. Our weekly Crypto Report is produced so that followers of the space can more easily stay on top of price action, technicals, seasonality, and sentiment.
Sign up for a monthly or annual subscription to Bespoke Crypto to receive our weekly Crypto Report and anything else we publish related to cryptos. Note: If you’re currently a Bespoke Premium, Bespoke Newsletter, or Bespoke Institutional subscriber, you’ll need to subscribe to Bespoke Crypto as an add-on to receive access. The weekly Crypto Report and any additional crypto analysis is not included with our Premium, Newsletter, or Institutional memberships. You can sign up for Bespoke Crypto and receive our Crypto Report in your inbox weekly using the monthly or annual checkout links below. If you sign up for the annual plan, the first year of access is 50% off!
Bespoke Crypto Access — Monthly Payment Plan ($49/mth)
Bespoke Crypto Access — Annual Payment Plan ($247.50 for the first 12 months, then $495/year in year 2 and beyond)

Bespoke Investment Group, LLC believes all information contained in this service to be accurate, but we do not guarantee its accuracy. None of the information in this service or any opinions expressed constitutes a solicitation of the purchase or sale of any securities, commodities, or cryptocurrencies. This service contains no buy or sell recommendations. This is not personalized advice. Investors should do their own research and/or work with an investment professional when making portfolio decisions. As always, past performance of any investment is not a guarantee of future results. Bespoke representatives or clients may have positions in securities discussed or mentioned in its published content.
Sep 1, 2022
Log-in here if you’re a member with access to the Closer.
Looking for deeper insight into markets? In tonight’s Closer sent to Bespoke Institutional clients, we show the dramatic outperformance of high yield credit, the disconnect between copper and rates, and the dollar’s new high to start out tonight’s note (page 1). We then dive into the latest PMI data (page 2) followed by a look at residential construction (page 3). Afterward, we review the latest housing inventory figures from Realtor.com (pages 4 and 5).
See today’s full post-market Closer and everything else Bespoke publishes by starting a 14-day trial to Bespoke Institutional today!