Nov 10, 2022
While today’s CPI print took the spotlight of positively received economic data, jobless claims have continued to rise a bit. Seasonally adjusted initial claims rose to 225K from last week’s 1K upwardly revised level of 217K. That is 1K below the early October high for the weakest level of claims since the end of the summer. Given recent readings, claims have been trending slightly higher but remain at historically strong levels.

On a non-seasonally adjusted basis, claims are swinging higher as is normal for this point of the year. In fact, the current week of the year has historically seen claims rise week over week 85% of the time. That ranks fourth as the week of the year most consistently to see claims rise. In spite of that expected increase, at 205K claims are much lower than the comparable week of years past.
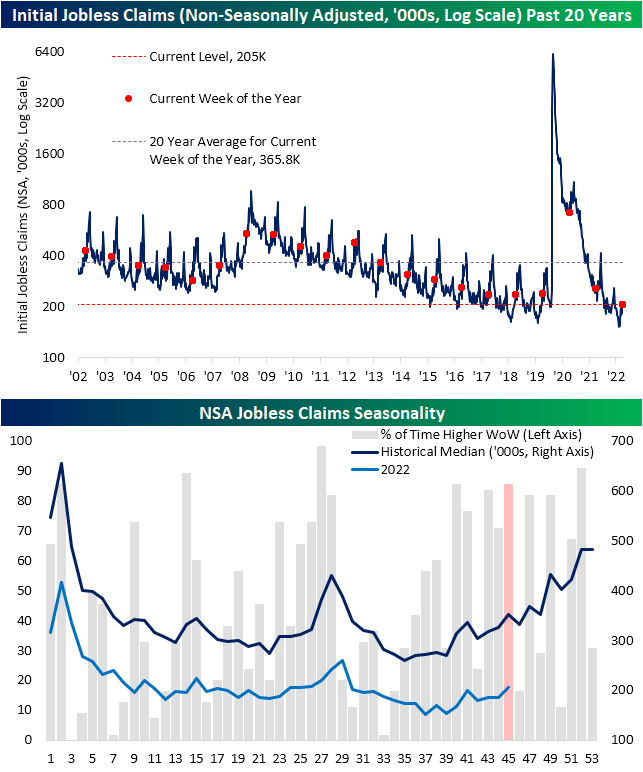
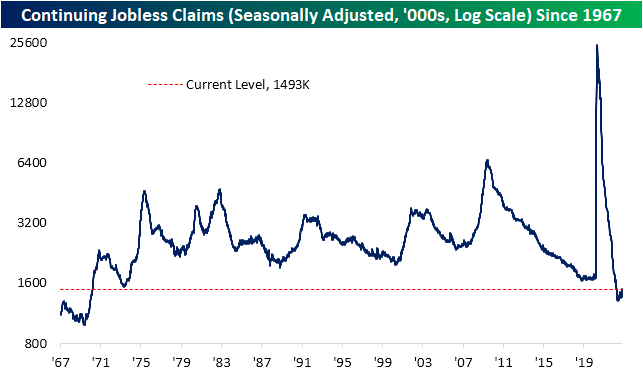
Without doubt, initial jobless claims paint a picture of solid health in the labor markets without much in the way of significant deterioration or improvement lately. Continuing claims are similar in sitting well below pre-pandemic levels that are some of the strongest of the past several decades. Unlike initial claims, though, continuing claims have been more consistently climbing in recent weeks. Now at 1.493 million, claims have risen in each of the past four weeks, bringing the reading to the highest level since the end of March. Click here to learn more about Bespoke’s premium stock market research service.
Nov 9, 2022
Log-in here if you’re a member with access to the Closer.
Looking for deeper insight into markets? In tonight’s Closer sent to Bespoke Institutional clients, we start out tonight review the further turmoil in crypto markets (page 1) followed by a recap of the latest wholesaler (page 2) and petroleum inventory data (page 3). We close out with a recap of the atrocious 10 year note auction held this afternoon (page 4).
See today’s full post-market Closer and everything else Bespoke publishes by starting a 14-day trial to Bespoke Institutional today!
Nov 9, 2022
As evident in our Sector Snapshots over the past several days and as we discussed yesterday on Twitter, sector performance has lately been a tale of the haves and have-nots. The areas of the market that possess some of the most heavily weighted stocks, namely Communication Services, Consumer Discretionary, and Technology, have drastically underperformed other cyclical sectors like Financials, Industrials, and Materials. As a result, relative strength lines have blown out. Shown another way, in the charts below, we show the ratios of each of these sectors relative to the S&P 500. A rising line would indicate the sector is outperforming the broader market and vice versa.
Communication Services has been in a brutal downtrend in relative strength terms for more than a year now and the recent drop has been steep. While the ratio of Consumer Discretionary to the S&P 500 has been more range bound in recent years, there have been a few wild swings in the past year. The most recent swing lower is leaving it close to the lowest levels since early 2015. Tech’s decline has not been nearly as sharp, but the ratio here has nonetheless rolled over to some of the lowest levels of the past few years. Conversely, Financials, Industrials, and Materials have all seen their ratios rip higher to the upper end of the past few years’ range.

In measuring just how sharp of moves these ratios have experienced, they have been outright historic. As for the most pronounced moves, the drops in the lines of Communication Services and Consumer Discretionary rank in the bottom percentile of all 10-day moves since 1990 when our sector data begins. The only periods in which the ratios fell by similar degrees, if not by more, were during the Dot Com bubble. While Tech’s ratio is at new multi-yea rlows, its decline was large (ranking in the 17th percentile) but not nearly as sharp, standing out much less than the aforementioned sectors.
Like Tech, the moves in Financials and Materials have also been quite large and rank in the top decile of all 10-day moves, but those are far from records. The outperformance of Industrials on the other hand, has been remarkable. As of yesterday’s close, the ratio versus the S&P 500 rose 7.24% over the past two weeks. Only three other days—May 19 through May 21, 2020—since 1990 have seen higher readings. Click here to learn more about Bespoke’s premium stock market research service.

Nov 9, 2022
High inflation and the aggressively hawkish monetary policy that has come in response, an election, and battered risk assets lend plenty of reason for investors to have sought out safe havens for their money this year. However one such asset, gold, has gotten crushed all the same. The yellow metal is down 18.5% from its 52-week high set in the early spring but on the bright side, it has begun to break out of its downtrend. As shown below, gold has tested support at roughly around $1,620 at multiple points this fall. After the last successful test only about a week ago, front-month futures have surged over 5%. The result has been an upside break of the longer-term downtrend as well as the 50-DMA. This is the first time since the spring gold has traded considerably above that moving average.
While that positive technical development is in the books, it is not necessarily out of the woods yet. There has not been a higher high yet meaning a move above last month’s unsuccessful test of its 50-DMA (around $1,730) would be the next hopeful sign for gold bugs.

Additionally, the current run has occurred at an interesting point in time. Historically considered a prime safe haven asset, gold’s run over the past few days has coincided with a couple of catalysts for uncertainty in the headlines: the midterm election and tomorrow’s CPI print. Based on where gold is trading as of this writing, the metal is up nearly 5.5% over the past four days. As shown below, in the four days leading up to every other CPI release since at least June 1998, that ranks as the fourth-best pre-CPI rally and only the fifth time it has rallied more than 5%. Click here to learn more about Bespoke’s premium stock market research service.
