Jul 20, 2022
Since June 16th, the market has reversed course higher, making the date at least a near-term bottom. From a technical perspective, the Russell 1000 broke through its 50-day moving average yesterday and broke above its upper downtrend line today. The 50-DMA is still moving lower, but this is the first time that the Russell 1000 has been above the 50-DMA since April 20th. However, the index is still 9.7% below its 200-DMA. These moves come as commodity prices have pulled back and earnings season begins.

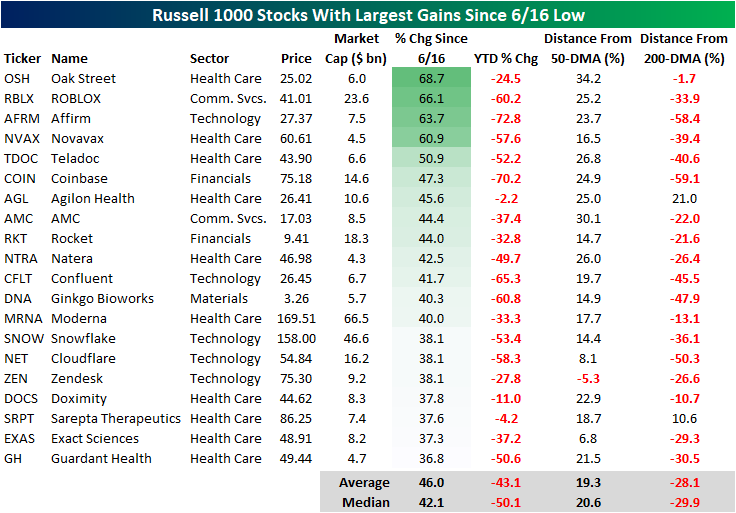
As we highlighted in a Chart of the Day earlier this week, the lagging sectors during bear market declines tend to be the leaders in bear market rallies, which is holding true in the bounce since 6/16. The table below shows the 20 best performing stocks in the Russell 1000 Index since the 6/16 low. As you can see, these stocks are all still down considerably on a YTD basis, declining a median of 50.1%. However, these stocks have rebounded by a median of 42.1% since the low on 6/16. Only one of these stocks is below its 50-DMA, and only two are above their respective 200-DMA. If you think that the bear market has concluded, these would be some of the names worth looking deeper into.
On the other hand, the best performing sectors during bear market declines tend to be the worst performing sectors during bear market rallies. Of the 20 worst performing Russell 1000 stocks since 6/16, 14 belong to the energy sector (which has been the best sector on a YTD basis by a wide margin). On a median basis, these 20 stocks are still up 13.6% on a YTD basis, but they’ve shed 13.7% of their value since the market bottomed in mid June. Notably, these stocks (on a median basis) are closer to their 200-DMAs than they are to their 50-DMAs. If you think that we are currently in a bear market rally that is bound to reverse course, these names would be worth looking deeper into.

Jul 19, 2022
Following earnings in recent days, both Goldman Sachs (GS) and Citigroup (C) have seen their stocks rip higher, resulting in rarely seen price moves for the stocks. Goldman’s trading segment benefited from increased trading volumes in FX, rate, and commodity markets, helping to fuel a beat on the top and bottom line. C also reported a top and bottom line beat, and every segment saw revenue rise y/y. Click here to view an in-depth analysis of these two earnings reports. Click here to learn more about Bespoke’s premium stock market research service.
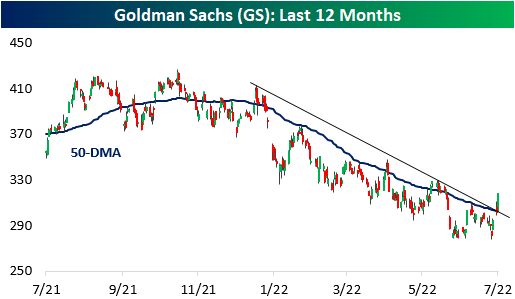
Since the close on July 14th (three trading days ago), GS has ripped 12.5% higher which is the largest three-day rally since May 2020. On its earnings reaction day (7/18), the stock gapped up over four percent but finished the day with a gain of 2.6%. Today, GS jumped an additional 5.5% higher. Notably, the stock has now broken its downtrend and its 50-day moving average, a bullish technical sign for the stock. However, the stock is still down close to 20% on the year, which is worse than the performance of the broader financial sector ETF (XLF).
Following three-day gains of over 12% for GS (for the first time in at least a month), the stock has underperformed its all-period performance on a median basis across each time period we looked at (one day, one week, one month, and three months). Positivity rates are lower as well, so it’s hard to view this occurrence as an overly optimistic signal. One data point to take note of is that the average absolute three-month change is significantly elevated at 20.5% (median: 21.6%). For all periods since its IPO, the average absolute three month price change has been 12.9% (median: 10.1%). If the historical pattern holds, this would suggest that the next three months for the stock will be more volatile than normal. Click here to learn more about Bespoke’s premium stock market research service.

Citi’s chart looks quite similar, and its rally has been even more impressive than the rally in GS as the stock also broke above both the 50-DMA and the downtrend that has been in place since early January. With a gain of 17%, the stock has seen its largest three-day rally since the days coming off the COVID lows in March 2020. Both stocks have also struggled to definitively break through the 50-DMA, so investors should watch these levels carefully over the next few trading sessions. For both stocks, the 50-DMA is still moving lower, but the performance over the last few trading sessions certainly helps the technical picture.

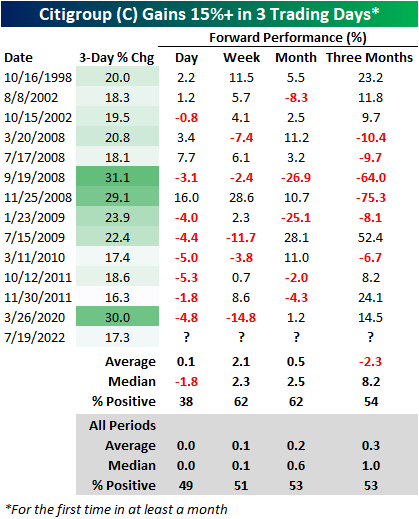
In terms of forward returns, C has had mixed performance following prior three-day gains of at least 17.0%. The table below shows all prior occurrences since the October 1998 merger between Travelers and Citigroup. Of the thirteen prior occurrences, C’s median next-day performance has been a loss of 1.8%, but the stock has booked a median gain of 2.3% over the following week. Over the next three months, C underperforms all periods on an average basis but significantly outperformed on a median basis, and positivity rates have been narrowly above that of all periods. Three months out, C has averaged an absolute move of 24.5% (median: 11.8%), which like GS, is much higher than the 13.2% (median: 9.1%) average absolute three-month change for all periods. Long story short, although the technical picture has improved for both GS and C, investors should continue to expect volatility ahead.
Jul 12, 2022
Today we are debuting our Growth at a Reasonable Price (GARP) Basket, which utilizes a proprietary algorithm in an attempt to find stocks that may be mispriced relative to their growth. In this report, we highlight some of the flaws of pure growth and value strategies before diving into the potential benefits of a GARP strategy. There are 50 stocks included in the GARP Basket, with brief descriptions provided for each one. This basket is weighted in proportion to S&P 1500 sector weightings and will be updated on a quarterly basis, which gives each company the ability to report an additional quarter of earnings.

Bespoke’s GARP Basket is available at the Bespoke Premium level and higher. You can sign up for Bespoke Premium now and receive a 14-day trial to read our GARP report. To sign up, choose either the monthly or annual checkout link below:
Bespoke Premium – Monthly Payment Plan
Bespoke Institutional – Annual Payment Plan
Jul 6, 2022
Up until June 8th, the Energy sector was the only thing working in the market. However, the sector has reversed dramatically, falling close to 25% since. This comes as the price of oil pulls back and the White House targets the entire vertical with accusations of profiteering. As any investor knows, the price of oil is not set by individual energy companies, but rather by the forces of the market. Interestingly, the same administration that is pressuring oil companies to increase supply campaigned on the fact that they would not allow for drilling permits to be renewed on federal land, so the current rhetoric is… interesting to say the least. To quote Biden himself: “Number one, no more subsidies for the fossil fuel industry. No more drilling on federal lands. No more drilling, including offshore. No ability for the oil industry to continue to drill, period.” Rhetoric like this can logically cause a reduction in domestic energy investments, as CFO’s adjust capital expenditures based on added legislative risk.
Nonetheless, the price of oil has pulled back significantly, which causes a compression in gross margins for suppliers. Oil is currently trading at about $100 per barrel. Although oil is still up over 33% YoY, it has pulled back by 23.3% relative to highs. Most industries will breath a sigh of relief, but energy companies will be in the other camp. Notably, crude recently broke its uptrend, and seven of the last 15 trading days have seen declines of 3% or more.

Below is a chart showing the rolling % of 3%+ daily declines over all 15-day periods. As you can see, this is an extremely elevated reading, surpassed by just The Great Recession and the COVID Crash. Following the high reading in 2008, XLE rebounded 8.9% in the next week and 7.8% over the next month. In March of 2020, XLE fell by an additional 13.1% over the next week, but rebounded 14.7% over the following month after the peak reading.

Below are snapshots of S&P 500 Energy stocks as they currently stand versus where they stood on June 8th when XLE peaked. All but one of the stocks have entered an oversold range after every single one was overbought as of 6/8. What a difference a month can make! On average, these stocks were up 66% YTD (median: 64.8%) on June 8th, but are now up an average of just 22.3% on a YTD basis (median: 18.0%). Between the close on 6/8 and 7/5, the average stock on this list fell by 26.1% (median: -26.7%), delivering pain to investors who bought the rip. Click here to learn more about Bespoke’s premium stock market research service.


Jun 30, 2022
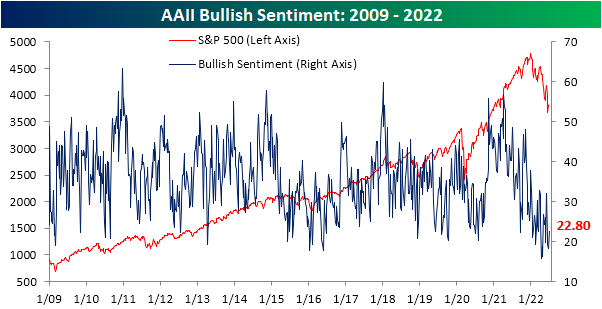
After two weeks of sub-20% readings, the share of respondents to the AAII sentiment survey reporting as bullish has risen back up to 22.8%. That increase in optimism comes on what has been pretty choppy price action in the past week as the S&P 500 had risen then given up roughly 3% since the last update of the AAII numbers.
The increase in bullish sentiment broke a streak of back-to-back-to-back declines, and the opposite shift in sentiment could be seen for bearish sentiment. The percentage of respondents reporting as pessimists fell by 12.6 percentage points in the latest week bringing the reading back below 50%. While the double-digit decline was large, the first week of June actually saw an even bigger drop of 16.4 percentage points.
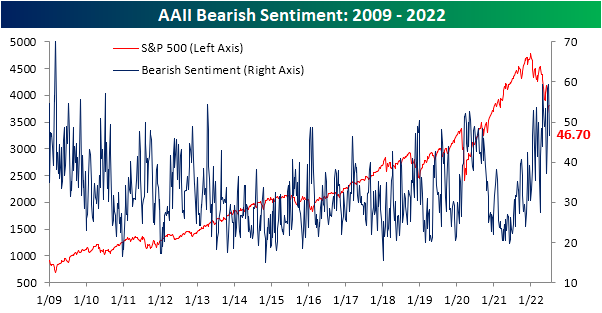
The significant inverse moves in bullish and bearish sentiment have resulted in the bull-bear spread to move higher, but at -23.9, sentiment continues to heavily favor the bears.

In fact, taking a four-week moving average of the bull-bear spread shows that the reading has been below -10 (meaning on average bears have outnumbered bulls by at least 10 percentage points) for 23 straight weeks. That continues to close in on the record six-month streak that ended in February 1991 as bulls are few and far between.

Given the drop in bears this week was far larger than the increase in the number of respondents reporting as bullish, the bulk of the sift went to the neutral camp. That reading rose 8 percentage points to 30.5%. While that only leaves the reading at the highest level since the week of June 9th, it was the largest one-week increase since the last week of March and ranks in the top decile of all week-over-week moves on record. Click here to learn more about Bespoke’s premium stock market research service.
