Jun 29, 2022
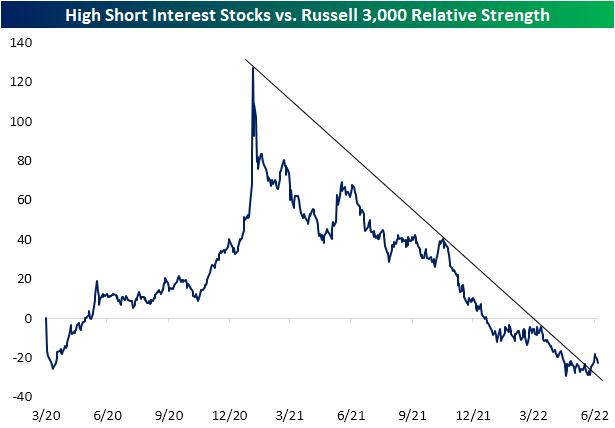
As we highlighted in a post yesterday, the relative strength of the 100 stocks with the highest levels of short interest against the Russell 3000 has broken its downtrend. This downtrend had been in place since the end of the meme stock mania in January of 2021. Just to refresh your memory, that chart is provided below.
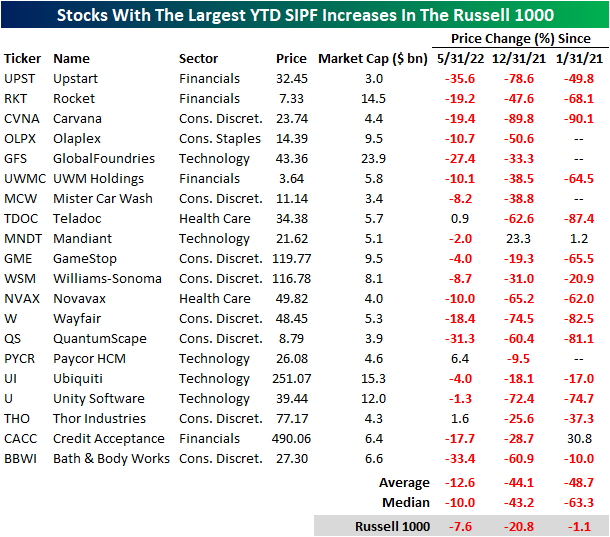
Today, we took a look at the 20 Russell 1000 stocks that have seen the largest increases in short interest as a percentage of float (SIPF) on a year to date basis. Leading this group is Upstart (UPST), the buy now pay later firm that has been decimated as growth stocks have gotten crushed and consumer confidence weakens to historic levels. UPST saw SIPF rise by 27.1 percentage points on a YTD basis and by an additional 2.0 percentage points in June. Notably, UPST appeared on our Top 20 P/S Decliners list as well, which we published yesterday. Unity Software (U) is the only other name to appear on both lists. The largest names on this list by market cap are GlobalFoundries (GFS), Ubiquiti (UI) and Rocket (RKT).

The performance of these twenty names has been quite weak on a month over month and YTD basis. Additionally, these names have massively underperformed the broader index since the end of the meme stock mania, trading down by 48.7% on average (median: -63.3%) compared to the Russell 1000’s loss of just 1.1%. On a YTD basis, these stocks have shed 44.1% of their value on average, which was accelerated by a 12.6% average loss since the end of May. Although it’s difficult to find any positivity in these names, they are primed for short squeezes or reversals as shorts cover their positions (which forces buying. Click here to learn more about Bespoke’s premium stock market research service.
Jun 27, 2022
The US stock market has been weak and in a downtrend since late 2021, and there are some individual names that haven’t been able to post a positive month in quite some time. Of all S&P 1500 members, there are actually eight stocks with a market cap of at least $2 billion that are on a monthly losing streak of seven or more months. Six of these eight names are members of the Consumer Discretionary sector (the worst performing sector on a YTD basis), which is down 27.8% in 2022 (as of Friday’s close). The largest company on this list is Nike (NKE), which reports after the close today. The stock would need to gain about 7.5% through the end of the month to break its seven month losing streak. The average stock on this list would need to gain 6.7% through the close on 6/31 to break their respective streaks. Etsy (ETSY) is the closest to breaking its streak, needing to gain just 0.9%, while Under Armour (UAA) is the furthest, needing 13.7%. On a YTD basis, these stocks are down an average of 41.4% (median: -35.0%), meaning they would need to gain ~70% through year’s end to finish 2022 in the green.

Below is a quick look at one-year price charts for these eight stocks. (You can click here to create a custom portfolio of these names if you’re a Bespoke client.) Unsurprisingly, these stocks on 7+ month losing streaks are trading in pretty steep long-term downtrends, and they’ve got a lot of work to do to get back to where they were trading late last year. New uptrends can’t emerge until these long monthly losing streaks finally come to an end. Click here to learn more about Bespoke’s premium stock market research service.

Jun 27, 2022
The Bespoke Emerging Market 50 tracks emerging market equities that have either strong earnings growth, the potential to recover substantially in the foreseeable future, or unique upside based on the current geopolitical environment. As the name implies, all of these companies are domiciled in emerging market economies (with ADRs). In this report, we highlight risks and opportunities in emerging markets before diving into the differences between our basket and the iShares MSCI Emerging Markets ETF (EEM). The back half of the report involves a brief summary of each of the 50 stocks in the basket, including fundamental insights, growth opportunities, and risks. The Bespoke Emerging Market 50 is updated on a quarterly basis.

The Bespoke Emerging Market 50 is available at the Bespoke Premium level and higher. You can sign up for Bespoke Premium now and receive a 14-day trial to read our Emerging Market 50 report. To sign up, choose either the monthly or annual checkout link below:
Bespoke Premium – Monthly Payment Plan
Bespoke Premium – Annual Payment Plan
Jun 14, 2022
See what’s driving market performance around the world in today’s Morning Lineup. Bespoke’s Morning Lineup is the best way to start your trading day. Read it now by starting a two-week trial to Bespoke Premium. CLICK HERE to learn more and start your trial.
“He says we’re going the wrong way.”
“Oh, he’s drunk. How would he know where we’re going.” – Planes, Trains & Automobiles

Below is a snippet of content from today’s Morning Lineup for Bespoke Premium members. Start a two-week trial to Bespoke Premium now to access the full report.
After four days of basically getting their faces beat inside out, bulls are trying to make a comeback this morning aided in part by a PPI report that wasn’t stronger than expected. Small business sentiment also managed to come in slightly better than expected, although it remains weak. One item covered in today’s Morning Lineup commentary is the fact that inflation expectations in the latest ZEW survey didn’t show a pickup in inflation expectations for the US or Eurozone.
In today’s Morning Lineup, there’s a lot covered as we discuss trading in APAC and European markets (pg 4), whether or not the Fed will go 50 or 75 bps tomorrow (pg 5), overnight economic data in Asia and Europe (pg 6), and much more.
Over the last two years or so, the market has come full circle. In February and March of 2020, there was that five-week period where the only direction the market would move was lower. Shortly after, the Federal Government and Federal Reserve unleashed massive amounts of stimulus, and the market started to turn around. By early 2021, the market had completed a complete 180, and the only direction it could move was higher. Then, late last year as government stimulus started to dry up and the Federal Reserve started to get religion on inflation, cracks in the market started to emerge. By early this year, we were calling it a one-step forward and two-step backward market where every positive day was offset by at least two bad days taking the market to progressively lower levels in the process.
As painful as the one-step forward and two-step backward market felt, at least there were some positive days. Over the last few days, it has become a one-directional market, and the direction has been extreme in the wrong way. Over the last four trading days, the net advance/decline (A/D) reading for the S&P 500 has been negative 400 or lower meaning that in each of the last four trading days there have been 400 more stocks that traded lower on the day than higher. To give you some perspective on how extreme this type of streak is, since 1990, there have been ten years where for the entire 12 months there weren’t even four days where the net A/D reading for the S&P 500 was at negative 400 or lower. As shown in the chart below, there has never been a streak of similar duration, and the only time there were even three consecutive days of -400 readings was in August 2015 at the height of concerns over the Chinese yuan devaluation.

Start a two-week trial to Bespoke Premium to read today’s full Morning Lineup.
Jun 7, 2022
The broader retail space has been weak relative to the S&P 500 so far this year. Much of this weakness came after Target’s (TGT) and Walmart’s (WMT) earnings calls, in which management noted margin compression, inventory gluts in certain categories, shifting consumer preferences, and weakness in consumer spending as inflation in food and energy reduces discretionary budgets. Institutional subscribers can view our Conference Call Recaps on these two companies by clicking here. On a YTD basis, the VanEck Retail ETF (RTH) has underperformed the S&P 500 (SPY) by 4.5 percentage points, trading down by 18.2% as of today. A chart of the relative strength of RTH vs SPY over the last year is shown below.

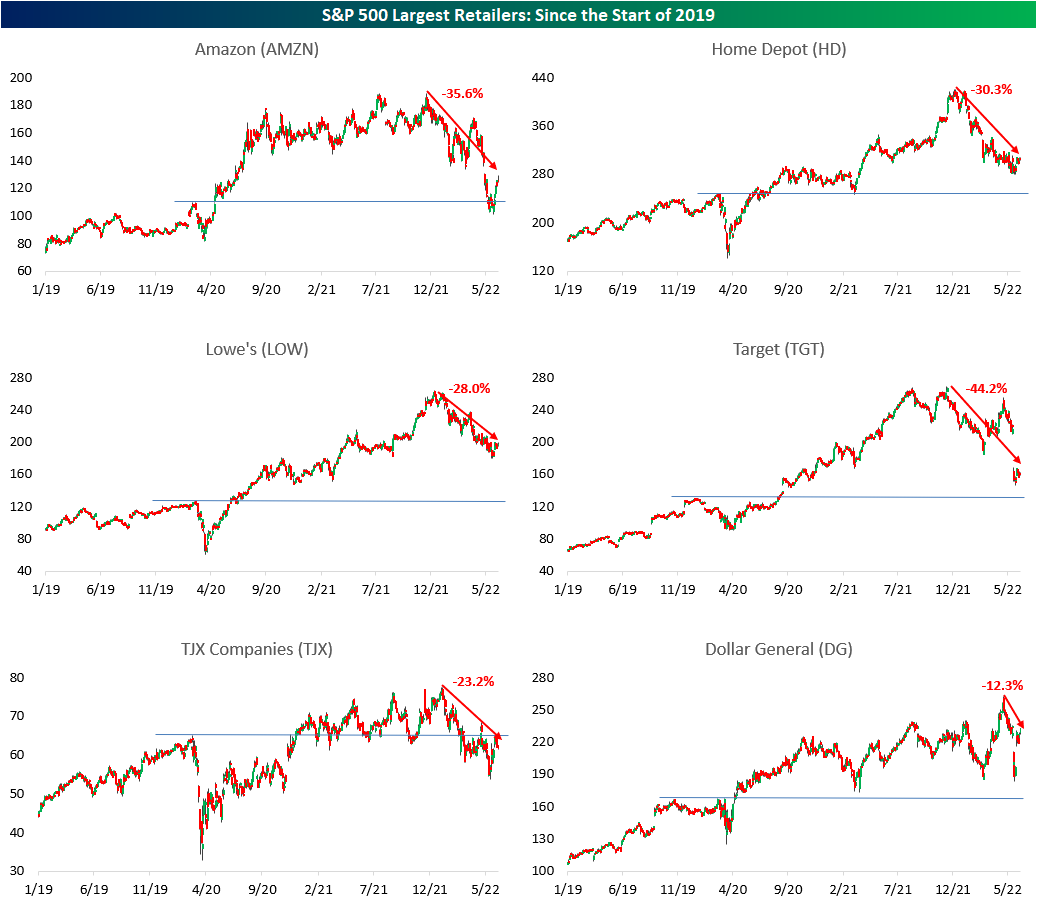
Within the S&P 500, there are 21 stocks that make up the Retailing industry, and in the table below, we have outlined the performance of the 10 largest stocks by market cap. You’ll notice that companies like Costco (COST) and WMT aren’t listed, but that’s because they are actually part of the Food and Staples Retailing industry. As you can see, seven of these ten stocks are down more than the average S&P 500 member on a YTD basis, and six are further from their respective 52-week highs than the average S&P 500 member. However, only two of these stocks are below their pre-COVID highs, whereas more than a third of (35.8%) of S&P 500 components are below their pre-COVID highs.

Below are charts of each of the 10 stocks listed above since the start of 2019. Included on each chart is the percentage that each is off its 52-week high. As you can see, AutoZone (AZO), Dollar Tree (DLTR) and Dollar General (DG) have held up relatively well amidst broader market weakness, likely due to their positioning on the value chain. The market seems to believe that consumers will move down the value chain amidst rising inflation, which makes our latest Little Known Stocks Report even more compelling. Click here to become a Bespoke premium member today!