Jun 2, 2022
With summer underway, we figured that it was an appropriate time to take a look at some of the stocks associated with beach & pool season. As shown below, Google searches for “beach”, “pool”, “boat” and “grill” are all actually elevated relative to historical levels during the week of May 31st, with each hitting a five year high. We’re actually seeing consumers searching for these popular summer activities at record rates, and they usually don’t peak until right around July 4th. This suggests “hot” activity as we roll into the summer months when consumers get outdoors. From an economic standpoint, it’s good to see searches at these levels especially with gas prices continuing to surge.

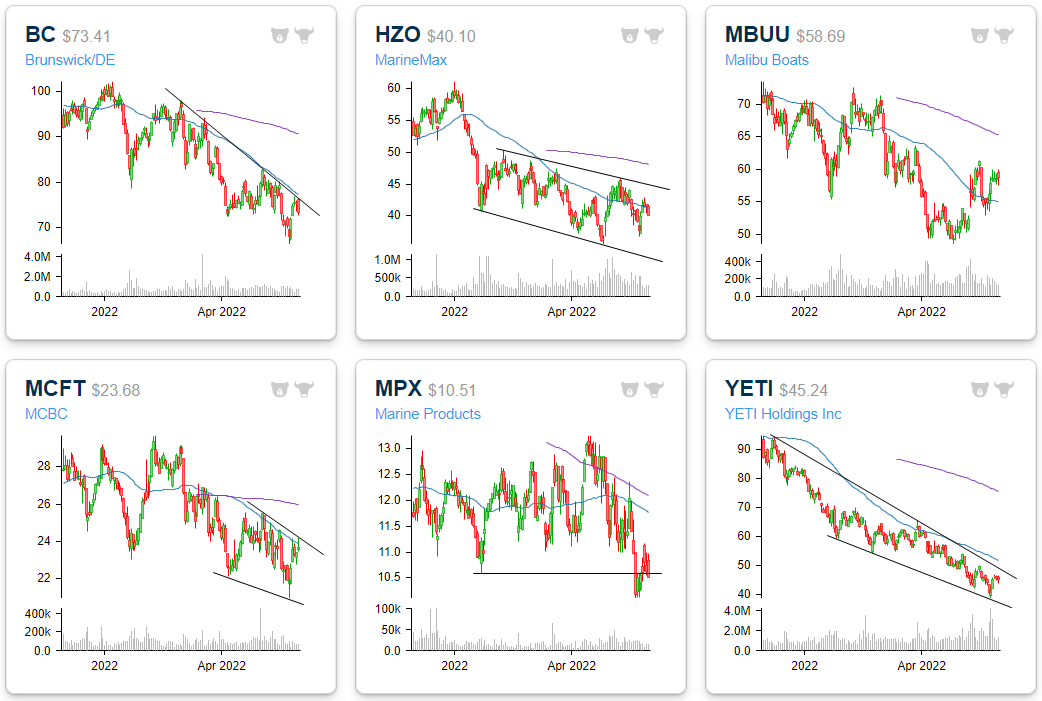
Although searches and interest in these activities are hitting a multi-year high, the prices of stocks with exposure to these industries have gone in the other direction. Starting with beaches and boats, six stocks with direct exposure include Brunswick (BC), Yeti (YETI), MarineMax (HZO), MasterCraft Boats (MCFT), Malibu Boats (MBUU), and Marine Products (MPX). On average, these stocks are down 24.9% year to date (median: -21.6%) and trade 1.2 times last twelve-month sales (median: 1.0). Although these stocks trade just 10.2 times LTM earnings per share (median: 8.5), they saw EPS rise by an average of 15.5% y/y in the most recent quarter (median: 13.4%). In the latest quarter, sales also improved by an average of 17.3% (median: 18.5%). Despite the relatively strong fundamental trends, investors appear to be looking forward anticipating weaker levels of growth once the pent up demand wanes.
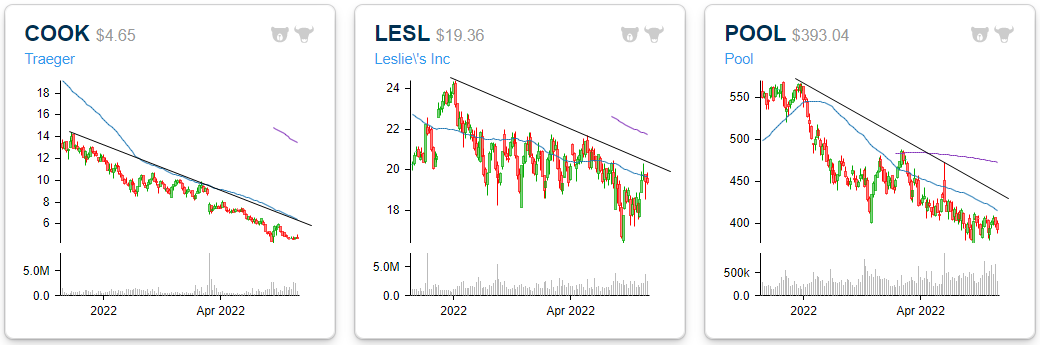
Within the pool and grill space, we were able to identify four near-pure plays: Pool Corp (POOL), Leslie’s (LESL), Traeger (COOK), and Weber (WEBR) which is not shown. On average, these stocks are down 37.8% (median: 36.0%) year to date compared to the S&P 500’s decline of just over 14%. These companies saw sales grow by 15.6% y/y on average (median: 18.5%) in the most recent quarter. The average price to sales multiple for this group is 1.6 (median: 1.6). Granted, the weak YTD performance can be largely attributed to WEBR and COOK, as the market has punished recent IPOs. Nonetheless, the underperformance is still notable given the assumed hike in demand.
Over the last twelve months, beach, pool, boat, and grill stocks (on an equal-weighted basis) have underperformed the S&P 500. This underperformance has been consistent. Granted, not all of the names on the list are pure plays, but all of the stocks have exposure to the space in one way or another. As you attend outdoor events at the bool, beach, or on the water in the coming weeks, keep these stocks in mind! Click here to become a Bespoke premium member today!

Apr 29, 2022
Amazon (AMZN) was one of the primary beneficiaries of the pandemic as consumers were forced to engage in commerce digitally and corporations became increasingly willing to migrate to the cloud. In the first year or so after the March 2020 COVID Crash, AMZN shares soared from $2,000 up to $3,700. Since peaking in mid-2021, however, it has been a different story. Since AMZN reported earnings last night, shares have fallen another 15%. This leaves AMZN up just 13.5% from the level it was trading at right before the pandemic began on 2/19/20.
Although the stock is now barely higher versus pre-COVID levels, revenues continue to climb. Relative to pre-pandemic levels, trailing 12-month revenues have increased by 70.3% (CAGR of 27.2%). As implied, the price to sales multiple has compressed considerably relative to pre-pandemic levels. At the highs, AMZN was trading 3.8 times sales. The highest P/S multiple for the stock since the start of 2020 occurred in September of 2020, when the multiple hit 5.5. As it currently stands, the price to sales multiple is at new lows relative to the start of 2020 at just 2.7.

While AMZN revenues are up 70% from pre-COVID levels, margins have compressed considerably. In Q1 2020, AMZN posted operating margins of 9.5%. In Q1 2022, AMZN reported operating margins of 3.2%. These results can be attributed to inflationary pressures, labor challenges, supply chain constraints and foreign exchange headwinds. As you can see in the chart below, margin compression has hampered EPS, resulting in a decline in trailing 12-month EPS over the last three quarters. Relative to pre-pandemic levels, EPS have risen by 52.5% (CAGR: 21.1%), but they’ve declined by 38.8% over the last three quarters. Click here to become a Bespoke Institutional subscriber and gain access to our Conference Call Recaps.

Apr 25, 2022
As shown in the snapshot of our Earnings Explorer below, the next two weeks will be the busiest parts of earnings season before things quiet down headed into May. While there will be many more from names not in the index, by next Friday, there will be a total of 917 S&P 1500 companies reporting results with next Thursday the single busiest single day as 184 companies report.

It’s not only a busy week of earnings in terms of the number of companies reporting, but also the size of those companies. In today’s Chart of the Day, we highlighted how this week will see some of the largest companies in the world releasing results all in the same week for just the eighth time on record. As shown below, even though next week will have a higher number of companies reporting, the combined market caps of the companies releasing quarterly results this week far outsize next week. Of course, that is largely thanks to mega-caps. For example, tomorrow there will be over $4 trillion in market cap reporting between three names alone: Visa (V), Alphabet (GOOG), and Microsoft (MSFT). Wednesday will see the half-trillion dollar Meta Platforms (FB) report followed by the biggest day of earnings by market cap on Thursday, totaling nearly $8 trillion. Again, two names alone are a huge share: Amazon (AMZN) and Apple (AAPL). Click here to view Bespoke’s premium membership options.

Apr 22, 2022
This week’s Bespoke Report newsletter is now available for members.
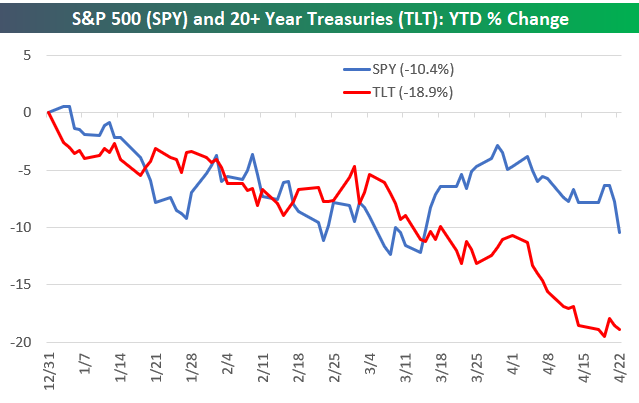
Early Thursday morning, investors were feeling pretty good about the trading week. At that point, the S&P 500 was up 1% on the day and about 2.7% week-to-date, and the index had actually just pushed back above its 200-day moving average.
There was nothing we could identify in the news that caused the S&P to peak around 10 AM ET, but from that point through the closing bell on Friday, the index fell 5.3% in basically as straight of a line lower that you can draw.

Fed Chair Powell did, however, make comments in a speech at the IMF mid-day Thursday where he confirmed that a 50 basis point hike was “on the table” for the May meeting. Markets have been pricing high odds for 50 bps hikes for some time now, but Powell’s comments basically cemented them (for now).
The Powell Fed is known for its jawboning and transparency when it comes to the path for rates. The chart below of equities and fixed income in 2022 tells you what these two asset classes currently think of that jawboning:
The snippet above is pulled from a page from this week’s Bespoke Report newsletter. If you’re not a Bespoke subscriber and you want to read this week’s full Bespoke Report (and access everything else Bespoke’s research platform has to offer), start a two-week trial to one of our three membership levels.


Apr 20, 2022
US Treasury yields have continued to move higher with mortgage rates rising in tow (we explained some key distinguishing characteristics of mortgages versus Treasuries in last night’s Closer). Bankrate.com’s national average for a 30-year fixed rate mortgage has now eclipsed 5.25% in the past week which is an over 2 percentage point increase year over year. Since the start of this series on mortgage rates going back to the late 1990s, that is by far the largest year-over-year increase on record.

Higher rates mean less attractive affordability so purchase applications have continued to fall per the latest Mortgage Bankers Association data. Seasonally adjusted purchase applications dropped 3% this week and are hovering just above the February lows.

The spring is often the hottest time of the year for housing activity. As shown below, the few weeks surrounding the current one have often marked the annual high (blue dots in chart below) in non-seasonally adjusted purchase applications over the past decade. This year that might not be the case. Activity has been running below that of the prior year and has plateaued more recently as mortgage rates have taken off. At the moment, this year’s high was set a little over a month ago in the second week of March. While a new high for the year is still within tangible reach from current levels—meaning upcoming weeks could still very well experience an uptick to a new high—this year has the potential to see a much earlier than usual high in mortgage purchases.

Refinance applications meanwhile are far weaker with unrelenting declines recently. This week marked the sixth week over week decline in a row leaving the MBA’s refinance index at the lowest level since February 2019. Click here to learn more about Bespoke’s premium stock market research service.
