The Bespoke Report Newsletter — 5/11/18
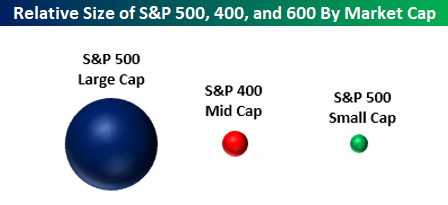
In this week’s Bespoke Report, one of the many topics covered was market weightings and market caps. The bubble chart below shows representations of the size of the large-cap S&P 500, the mid-cap S&P 400, and the small-cap S&P 600. When we speak with a lot of investors, we often hear these asset classes discussed like they are interchangeable. The reality is that they are very different. The S&P 500 is 29 times the size of the S&P 600 small cap index. Therefore, while it has little impact for an individual investor, collectively speaking, any new money in (or out) of the market will have a much more significant impact on small caps than it will on large caps. Think of it like dropping an ice cube in a full glass of water versus a bathtub.
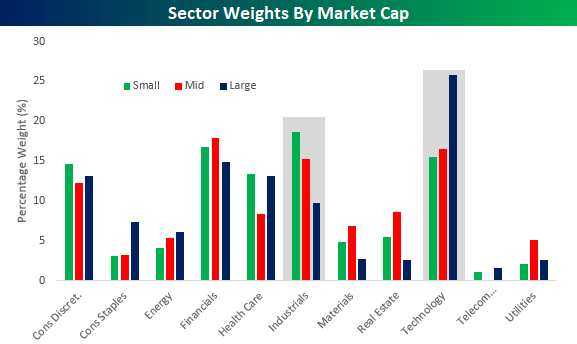
A second chart we wanted to highlight was sector weightings by market cap. While the Technology sector’s weighting is abnormally large in the S&P 500 large-cap index at over 25%, within the small and mid-cap indices, it is at a much more reasonable level of around 15%. In the small and mid-cap indices, the sector that has an abnormally large weighting is actually Industrials. Whereas the sector’s weight is under 10% in the S&P 500, it has a weighting of over 15% in the S&P 400 mid-cap index and a weight of over 18% in the S&P 600 small cap index.
With these weighting abnormalities in mind, when the Technology sector rallies, it has an exaggerated impact on large caps relative to small and mid caps, while an Industrials led rally has a more positive impact on mid and small caps.
As mentioned above, these charts are from our just-published weekly Bespoke Report newsletter, which provides an in-depth review of recent market action and events. To read this week’s Bespoke Report in its entirety, start a two-week free trial to any Bespoke membership level by clicking the button below.
Energy Continues to Lose Weight

Below is a snapshot of current S&P 500 sector weightings. As shown, Technology stocks currently makes up 20.01% of the index, while Telecom stocks make up just 2.45% of the index.
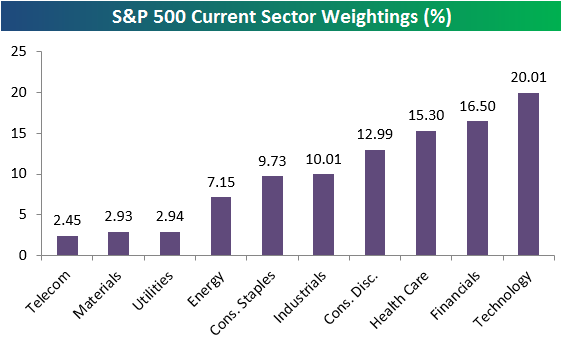
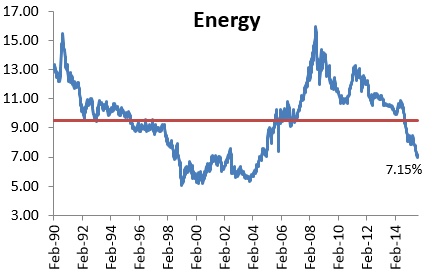
The reason we’re highlighting sector weights is to show just how much weight Energy has lost. After making up more than 15% of the S&P 500 when oil peaked back in early 2008, Energy has lost more than half of its weighting in the index. As of today, Energy stocks make up just 7.15% of the index, and it was in the 6s just a few days ago. With an average weighting of roughly 9.5% historically going back to 1990, Energy is currently well under its “normal” reading. That’s what happens when oil prices crash and the sector enters a bear market. If you’re a long-term investor that likes to “buy low and sell high,” you’d be “buying low” relatively speaking right now.
Enter “crude” in the coupon code section of our Bespoke Institutional subscribe page to receive 10% off the regular price for the life of the membership!

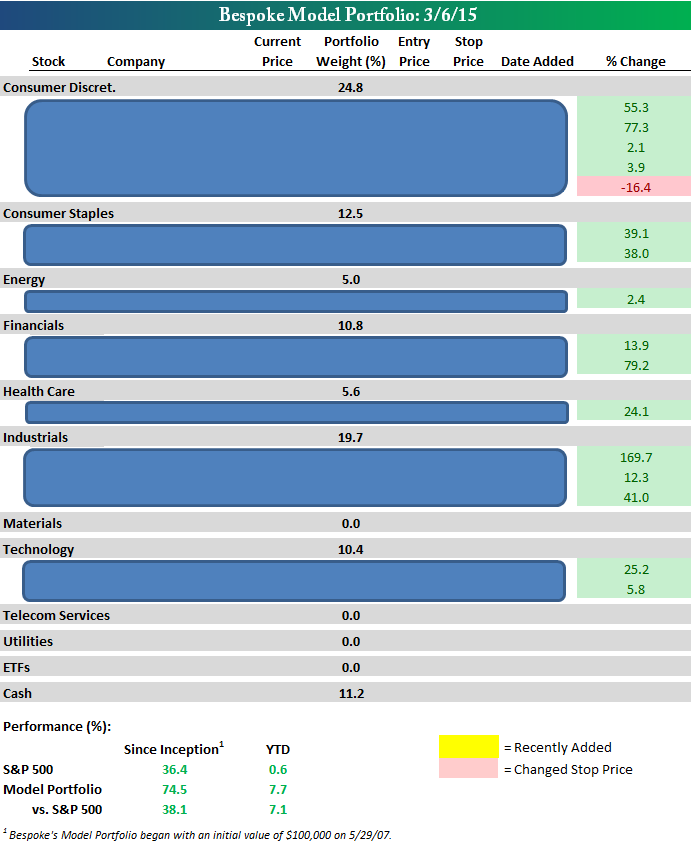
Bespoke’s Model Stock Portfolio
At the end of each week’s Bespoke Report newsletter, we publish an updated snapshot of our Bespoke Model Stock Portfolio. Below is a snapshot of the portfolio with sector weightings and performance numbers included, but the individual stocks are blocked out.
Interested in seeing the actual stocks that make up the Bespoke Model Stock Portfolio? Sign up for a 5-day free trial to our Bespoke Premium service and gain access now.

Bespoke’s Morning Lineup – 6/24/26 – Alphabet Gets a Seat at the Table
See what’s driving market performance around the world in today’s Morning Lineup. Bespoke’s Morning Lineup is the best way to start your trading day. Read it now by starting a two-week trial to Bespoke Premium. CLICK HERE to learn more and start your trial.
“The most effective leader is the one who satisfies the psychological needs of his followers.” – David Ogilvy

Below is a snippet of commentary from today’s Morning Lineup. Start a two-week trial to Bespoke Premium to view the full report.
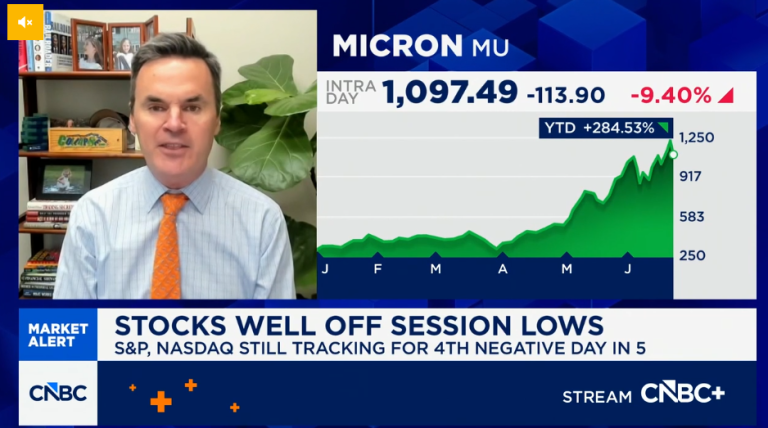
Paul Hickey appeared on CNBC’s Squawk on the Street yesterday to discuss the sell-off in tech and rotation into other sectors. To view the segment, click on the image below.
Stocks are looking to recoup some of Tuesday’s losses as Nasdaq futures rally 0.6% and the S&P 500 stands to gain 0.3%. Bond yields are lower, with the 10-year Treasury falling back down to 4.5% while WTI oil prices drop 3% to $71 per barrel. Gold prices are also down over 2% and not far from breaking the psychologically important level of $4,000 per ounce. Bitcoin is moving in the opposite direction, rallying nearly 1%.
It’s a slow day for data, with New Home Sales being the only economic report on the calendar, but after the bell, investors will be focused on Micron (MU) earnings, which are sure to cause some big moves in the memory sector.
Asian stocks generally rebounded overnight, except for Japan, which fell 0.9%. South Korea bounced 3.3%, erasing one-third of its losses from Tuesday’s session, while Chinese stocks were up fractionally. Traders in South Korea were somewhat comforted by news that Samsung would buy back $58 billion in stock, while SK Hynix said it would proceed with its US listing in early July.
In Europe, the STOXX 600 is slightly lower. French stocks are outperforming with a slight gain, while Germany is the big laggard, falling over 1%. Weakness in Europe’s largest industrial economy comes on the heels of reports that the German government cancelled plans to build six new warships, and that Rheinmetall shares plunging more than 15%.
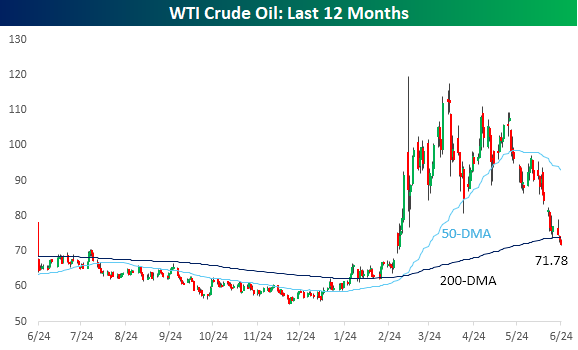
Crude oil prices are lower again this morning, and WTI is down below $72 per barrel for the first time since March 3rd and below its 200-day moving average for the first time since April. Consider this: in May, crude oil prices averaged over $98 per barrel. Today, WTI is 27% lower.
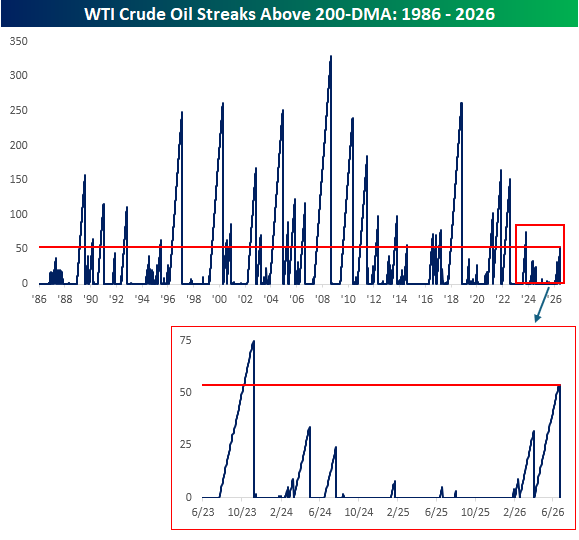
Yesterday’s decline in WTI ended a streak of 54 trading days where the commodity closed above its 200-DMA. As shown in the chart below, that’s far from extreme on a historical basis, but it was the longest streak in nearly three years.
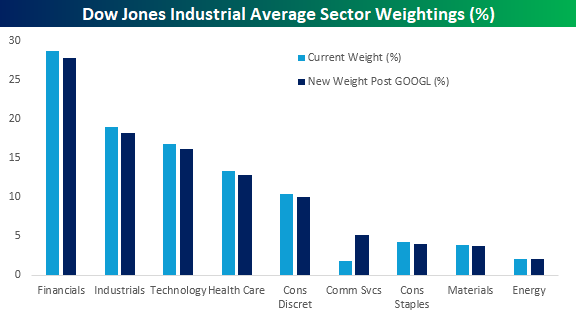
Outside of Energy, S&P Global announced last night that Alphabet (GOOGL) would replace Verizon (VZ) in the Dow Jones Industrial Average. While both stocks are in the Communication Services sector, it will have a notable impact on sector representation in the index. Not because GOOGL has a market cap that’s more than 20 times greater than VZ’s, but instead because its share price is 7.5 times greater (and the Dow is a share price-weighted index).
As the chart below illustrates, every other sector in the will see its weighting decline marginally while Communication Services will see its weighting increase from 1.8% to 5.2% of the index.
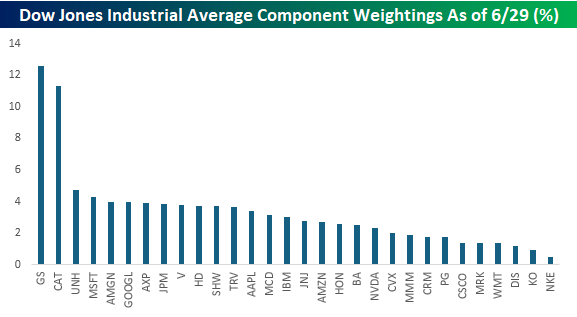
At the individual stock level, based on yesterday’s closing levels, GOOGL will enter the Dow as the sixth-largest component in the index with a weighting of just under 4%. As shown in the chart below, thirteen of the index’s 30 components have weights of between 3% and 5%, but the big outliers are Goldman Sachs (GS) and Caterpillar (CAT). With GS having a share price of nearly $1,100 and CAT closing yesterday just below $1,000, both stocks have weightings of more than 11% each. At the other end of the spectrum, after VZ’s removal, Coca-Cola (KO) and Nike (NKE) will be the only two stocks in the index with weightings below 1%.
Start a two-week trial to Bespoke Premium to continue reading today’s full Morning Lineup.