The Closer – Turnaround Holds True; Wither Energy – 8/6/19
Log-in here if you’re a member with access to the Closer.
Looking for deeper insight on markets? In tonight’s Closer sent to Bespoke Institutional clients, we cover quite a few topics including what led the bounce back today, S&P 500 sector weightings and the drop to multi-decade lows for Energy, analyst buy ratings by sector, and the average share price of stocks in the S&P 500.

See today’s post-market Closer and everything else Bespoke publishes by starting a 14-day free trial to Bespoke Institutional today!
Four Members of the $800+ Billion Market Cap Club
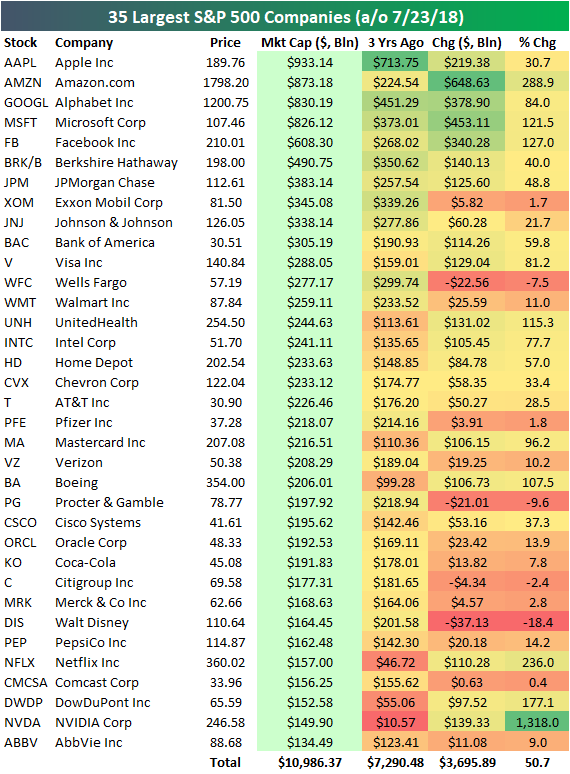
Below is an updated look at the 35 largest S&P 500 companies. It’s worth noting that recent gains have put four companies into the $800+ billion market cap club. Apple (AAPL) is still on top with a market cap of $933 billion, followed by Amazon (AMZN) at $873 billion, Alphabet (GOOGL) at $830 billion, and Microsoft (MSFT) at $826 billion. It’s easy to forget that Microsoft (MSFT) was a company left for dead in the early part of this bull market. Its turnaround over the last few years driven by its shift to the Microsoft 365 “software as a subscription” model has been impressive to watch in real time.
You’ll notice that the five largest companies are all Tech-related, while the 6th through 14th largest companies are non-Tech. You have to move down to the #15 spot — Intel (INTC) — to find the next Tech company, and after that the next Tech company is Cisco (CSCO) at #24.
For each stock on the list, we also show where its market cap stood 3 years ago on July 23rd, 2015. The seven largest companies right now have all seen their market caps rise by at least 30% over the last 3 years. Even JP Morgan (JPM) — which ranks 7th — has seen its market cap jump nearly 50% from $257.5 billion up to $383 billion. Three years ago, a market cap of $383 billion would have ranked as the 3rd largest company in the US.
Netflix (NFLX) and NVIDIA (NVDA) are the two other stocks worth pointing out. Netflix has seen its market cap jump from $46.7 billion up to $157 billion over the last 3 years, which makes it the 31st largest company in the S&P. The rise for NVDA has been even more impressive, as it has seen a jump from just $10 billion up to $147 billion — a gain of 1,318%.
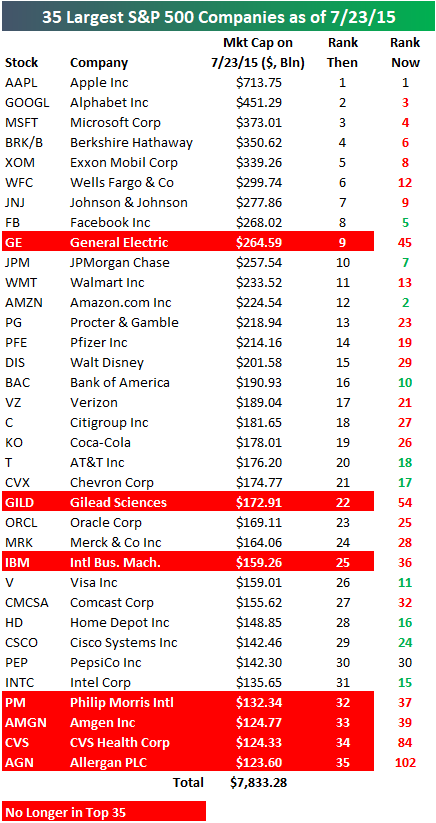
Below we show a snapshot of the 35 largest companies as of three years ago on July 23rd, 2015. For each stock on the list, we include where it ranked then in terms of market cap and where it ranks now. Apple (AAPL) ranked #1 then and it ranks #1 now, but the next six largest companies as of three years ago have all dropped in the rankings.
Amazon.com (AMZN) has seen the biggest jump from 12th place up to 2nd — increasing its market cap by $648 billion over the last 3 years!
On the downside, the biggest drop has been General Electric (GE) — which has fallen from 9th place down to 45th place (it used to be in first place too!). Along with GE, six other stocks have fallen out of the top 35 over the last 3 years — GILD, IBM, PM, AMGN, CVS, and AGN.
Start a two-week free trial to Bespoke Premium for a look at the changing landscape of S&P 500 sector weightings over the years.
Cyclical to Non-Cyclical Stock Weighting Ratio at 40 Year High
Below is an updated look at S&P 500 sector weightings. As shown, Technology now makes up more than a quarter of the pie, while Financials, Health Care, and Consumer Discretionary are the next largest sectors (in that order).
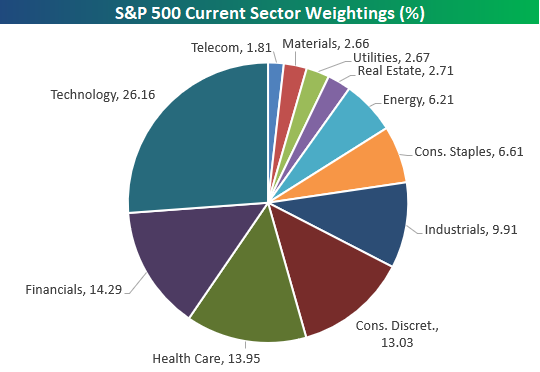
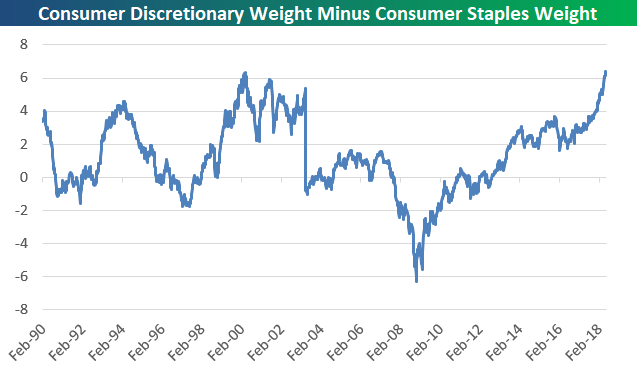
Notably, the Consumer Discretionary sector’s weighting of 13.03% is nearly twice as large as the weighting of 6.61% for Consumer Staples. Below is a chart showing the spread between the weighting of the Discretionary sector vs. the Staples sector. At +6.42 percentage points, the spread is at a record high going back to 1990.
The record spread between Discretionary and Staples certainly tells us that the economy has been rolling, but it should also start to offer a bit of a warning sign for investors. The prior record for this spread came at the very end of the Dot Com boom of the late 90s, when Tech was on fire (as it is now) and the economy was also rolling. The low for the spread came at the depths of the Financial Crisis in early 2009. It’s not rocket science — you know which of these two points in time was the better buying opportunity for investors!