Bespoke Brunch Reads: 3/1/20
Welcome to Bespoke Brunch Reads — a linkfest of the favorite things we read over the past week. The links are mostly market related, but there are some other interesting subjects covered as well. We hope you enjoy the food for thought as a supplement to the research we provide you during the week.
While you’re here, join Bespoke Premium for 3 months for just $95 with our 2020 Annual Outlook special offer.
Covid-19
Panic buying strips store shelves as people stockpile amid coronavirus outbreak with one woman turning her basement into a ‘supermarket’ and a man buying a YEAR’S supply of food which includes 192 tins of SPAM by Emily Crane (Daily Mail)
Stockpiling ahead of a nearly-inevitable Covid-19 outbreak inside the US is not yet reaching any kind of fever pitch but some early buyers are looking for canned goods, cough medicines, masks, and thermometers. [Link; auto-playing video]
Amazon bars 1 million products for false coronavirus claims by Jeffrey Dastin (Yahoo!/Reuters)
As snake oil salesmen flock to the online marketplace, Amazon has stepped in and blocked listings for products which claim to be able to kill the Covid-19 virus. [Link]
How One Patient Turned Korea’s Virus Outbreak Into an Epidemic by Heesu Lee and Kyunghee Park (Bloomberg)
A member of a secretive, apocalyptic religious sect helped turbocharge the outbreak of coronavirus in Korea by passing the virus to members of her church and beyond. [Link; soft paywall, auto-playing video]
Why Some COVID-19 Cases Are Worse than Others by Katarina Zimmer (The Scientist)
A very helpful and detailed analysis of factors that make the Covid-2019 outbreak so dangerous to the elderly but of so little concern to younger members of the population. [Link]
Lessons From Singapore
Singapore Emerges as Litmus Test for Coronavirus Containment by Philip Heijmans (Bloomberg)
The city-state’s world-class health care system has been able to cap spread of cases while also delivering a much lower death rate than what’s been observed in Wuhan. [Link; soft paywall, auto-playing video]
Living With Coronavirus Anxiety In Singapore by Megan K. Stack (The NYer)
An investigation of how pandemics change the lives of people and the broader community, regardless of how many are infected by whatever the pathogen is. [Link]
Sentiment
Reddit’s Profane, Greedy Traders Are Shaking Up the Stock Market by Luke Kawa (Bloomberg)
Every bull market inevitably has its small corners of extreme excess, and the huge gains for the stock market at the end of 2019 and start of 2020 are no different: welcome to r/wallstreetbets! [Link; soft paywall]
Bloomberg U.S. Startups Barometer (Bloomberg)
A catalog of the current funding backdrop for Silicon Valley, which has seen a plunge to multi-year lows in deals, deal amounts, first financings and exits that portends poorly for the space. [Link; soft paywall]
Fraaaaaud!
I stumbled across a huge Airbnb scam that’s taking over London by James Temperton (Wired)
While the company claims it’s been able to step up enforcement against malefactors that use its service, recent evidence from the capitol of the UK shows fraud is absolutely rampant on the platform. [Link]
How North Korean Hackers Rob Banks Around the World by Ben Buchanan (Wired)
There’s a long history of North Korean efforts to both fund its economy and attack the American economy via counterfeiting of currency, but the country has now moved into hacking banks instead of simple physical bill printing. [Link]
Millennial Women Made LuLaRoe Billions. Then They Paid The Price. by Stephanie McNeal (BuzzFeed)
The latest multi-level marketing scheme to wreck havoc on victims of its over-promised, under-delivered pitch of financial freedom was targeted at women approaching middle age who wanted to cover student loans and keep heads above water in a challenging post-crisis economy. [Link]
Sports Yarns
That Time Obama Pardoned a Guy Who Stole Charlie Sheen’s Honus Wagner Card by Jon Wertheim (Sports Illustrated)
Kick back, relax, and enjoy this zany tail about one of the most expensive baseball cards in history and one of the stranger pardons that ended up ending the affair. [Link]
Olympian’s cameo caps DeKalb student’s Black History Month report by Marlon A. Walker (AJC)
An assignment to do a project on Afro-Latinos who had made a big impact on society got taken above and beyond: with a visit to Barack Obama Elementary Magnet School of Technology from Olympian and civil rights icon John Carlos. [Link]
Durable Goods
The Case for the $100,000 Mattress by Alicia Brunker (Architectural Digest)
Online mattress sellers are passé, with the $149,000 Savoir mattress (which takes 320 hours of craftsmanship in Sweden to create) the undisputed leader of sleeping luxury. [Link]
Where’s My Cup? Offices Find It’s Not Easy Going Green by Te-Ping Chen (WSJ)
Going green isn’t always easy, though one does wonder how inconvenient keeping track of a water bottle could possibly be. [Link; paywall]
Qui Custodiet?
Facial-Recognition Company That Works With Law Enforcement Says Entire Client List Was Stolen by Betsy Swan (The Daily Beast)
It’s pretty hard to believe a company that can’t keep its client list locked down deserves to have billions of pictures designed to create a near-panopticon surveillance infrastructure. [Link]
Climate Change
Newly waterproofed Arctic seed vault hits 1m samples by Damian Carrington (The Guardian)
A seed vault buried in Svaldbard has been upgraded to prevent flooding due to warmer temperatures, but now holds over 1mm samples as part of an effort to prevent a catastrophic loss of global biodiversity. [Link]
Read Bespoke’s most actionable market research by joining Bespoke Premium today! Get started here.
Have a great weekend!
The Bespoke Report — 2/28/20 – Global Macro Update
The Closer: End of Week Charts — 2/28/20
Looking for deeper insight on global markets and economics? In tonight’s Closer sent to Bespoke clients, we recap weekly price action in major asset classes, update economic surprise index data for major economies, chart the weekly Commitment of Traders report from the CFTC, and provide our normal nightly update on ETF performance, volume and price movers, and the Bespoke Market Timing Model. We also take a look at the trend in various developed market FX markets.

The Closer is one of our most popular reports, and you can sign up for a free trial below to see it!
See tonight’s Closer by starting a two-week free trial to Bespoke Institutional now!
Daily Sector Snapshot — 2/28/20
Can the Market Bottom on a Friday?
It’s often said that equity markets can’t bottom on a Friday. One of the reasons for this line of thinking is that during a market downturn, no one wants to hold onto or bid up equities into a weekend for fear of further bad news. It may just be a matter of semantics, but based on that line of reasoning, the more accurate way to phrase it would be that markets can’t bottom on a Thursday or rallies can’t begin on a Friday. However you want to think about it, the chart below shows the number of times the closing low of a 10%+ correction has occurred on various weekdays.
Of the 97 S&P 500 corrections since 1928, the day of the week that has marked the low close of a 10%+ decline the least frequently is actually Wednesday with only 10. Behind Wednesday, Friday has been the second most infrequent day of the week for a bottom (15), and Thursday is the only other day of the week where the S&P 500 has made a low on a closing basis less than 20 times. The days of the week where the S&P 500 most frequently bottoms are Monday and Tuesday with 26 and 28, respectively. Start a two-week free trial to Bespoke Institutional to access our full suite of research services and interactive tools.
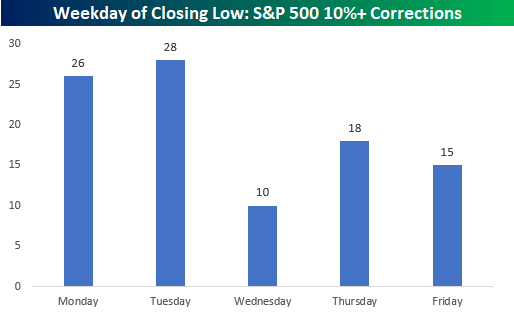
Regarding bear markets (20%+ declines), the trend is very similar. Bear markets have been the least likely to end on a Wednesday or Friday and most likely to end on a Tuesday.

Dividend Stock Spotlight: S&P 500’s Highest Yielders From The Sell-Off
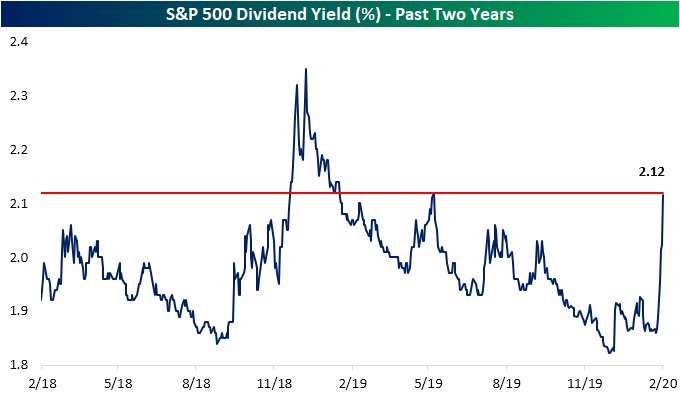
Given the lower prices of stocks, dividend yields have been on the rise over the past couple of weeks. The dividend yield of the S&P 500 now stands at 2.12% which is the highest since June 3rd of last year when it reached the same level, but only stayed there for a single day. Prior to that, yields were only higher during the Q4 2018 sell-off through February of 2019. At the beginning of the current sell-off on February 19th, the S&P 500’s yield was 26 bps lower at 1.86%.
Of the individual stocks in the index, there are now 81 stocks that have dividend yields of 4% or more. That compares to only 64 at the beginning of the sell-off. In the table below, we show the 25 highest yielders of the S&P 500 as well as the price change and change in the dividend yield since the 2/19 record high. As shown, there is only one stock, Macy’s (M), that yields over 10% at the moment. This major retailer has fallen out of favor in the past few years but the stock has gotten crushed since the 2/19 market peak having fallen just under 21% in that time. That decline has raised the dividend yield by 2.44 percentage points, but there is one other stock that has seen its yield increase by even more. That stock is Occidental Petroleum (OXY), the second-highest yielder in the index (9.93%). Being an Energy name, OXY has fallen the most dramatically (-29.05%) since 2/19 of all the highest yielders.

While there is a lot of overlap, in the table below we show the stocks that have seen their dividend yields rise the most as stocks have declined since 2/19. Again OXY and M top the list. While no other stocks have seen their dividend yields increase by more than 2 percentage points, there are another 17 who have risen by at least 1 percentage point. Notably, two cruise line stocks, Carnival (CCL) and Royal Caribbean (RCL) find themselves on this list. Carnival (CCL) now yields 6.28% while Royal Caribbean (RCL) yields 4.05%. Start a two-week free trial to Bespoke Institutional to access our Dividend Income Model Portfolio as well as our full range of research and interactive tools.

B.I.G. Tips – Biggest One-Week Drops in History
The Biggest Losers (and a few winners)
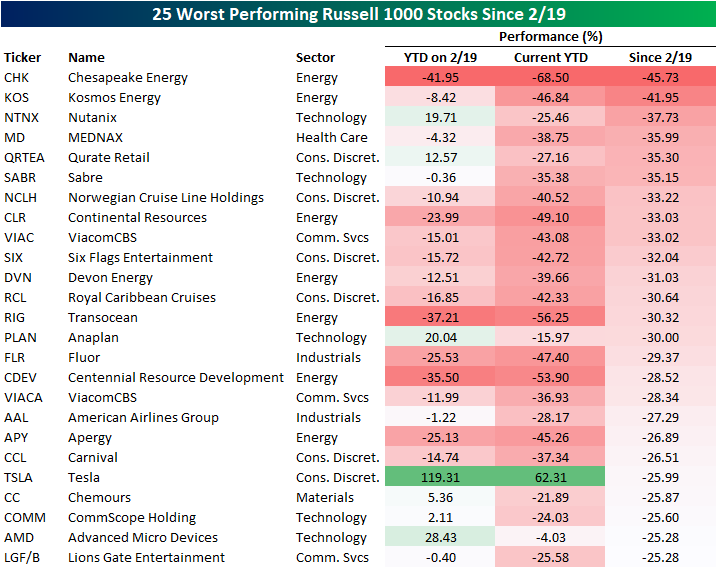
It is no secret that energy stocks have gotten crushed this year, and the list of the 25 worst-performing stocks in the Russell 1000 since the previous record close on February 19th is a prime example of this. Seven energy stocks find themselves on this list, two of which, Chesapeake Energy (CHK) and Kosmos Energy (KOS), take up the number one and two spots having fallen 45.73% and 41.95%, respectively since 2/19. CHK had already been weak headed into the broader market sell-off with a YTD loss on 2/19 over 40%; the past week has added fuel to the fire as it is now down 68.5% YTD. Continental (CLR), Centennial Resource Development (CDEV), Transocean (RIG), and Apergy (APY) are other energy stocks that were down 20% or more on the year headed into this sell-off, and each one has fallen another 20%+ since the 19th. While most of the other biggest losers since 2/19 had already been down on the year, there are some that have seen their gains in 2020 get erased due to this sell-off like Nutanix (NTNX), Qurate Retail (QRTEA), Anaplan (PLAN), Advanced Micro Devices (AMD), Chemours (CC), and CommScope (COMM). Some other notable losers of this group have been those heavily reliant on travel like American Airlines (AAL) and the cruise line stocks like Norwegian (NCLH) and Royal Caribbean (RCL).
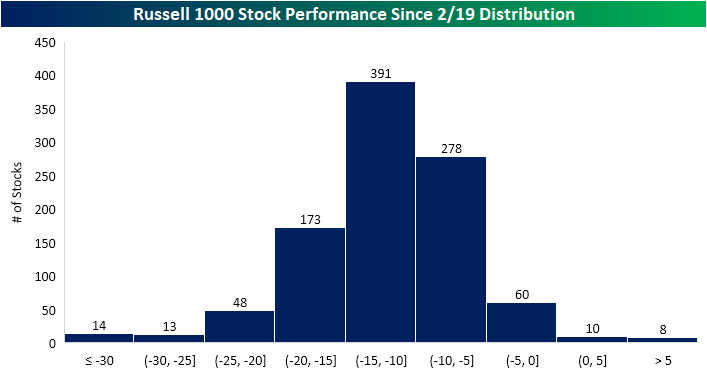
Given how breadth has been over the past week, it may not come as any surprise that since the February 19th high there are only 18 stocks of 1000 in the Russell 1000 index that are higher. Four of those are up less than one percent. In the table below we show all of these stocks. Given the sell-off has centered around coronavirus fears, it is sensical that a coronavirus vaccine developer Moderna (MRNA) is the best performing stock since 2/19. What is amazing is there was not much momentum with this name headed into the sell-off. As of 2/19, the stock was actually down 3.27% year to date, but as the Covid-19 saga has moved along it is now up well north of 30% on the year. A few other health care names like Regeneron (REGN) and Gilead (GILD) have also benefited from the coronavirus.

The histogram below shows the distribution of performance of Russell 1000 stocks since 2/19. As mentioned above, there are very few stocks in the index that are up since the 2/19 high. The highest share of stocks are down between 10% and 15% while the next highest share are down between 5% and 10%. Of the worst decliners, there are 75 stocks that have fallen over 20%.
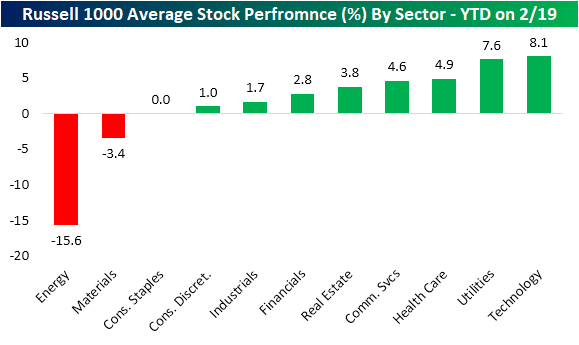
Looking at the individual sectors, again Energy was extremely weak even before equities sold off. On 2/19, the average Energy stock in the Russell 1000 in that sector was down 15.6% YTD. While they hadn’t tipped into the red yet, Consumer Staples were only up 1 bp.
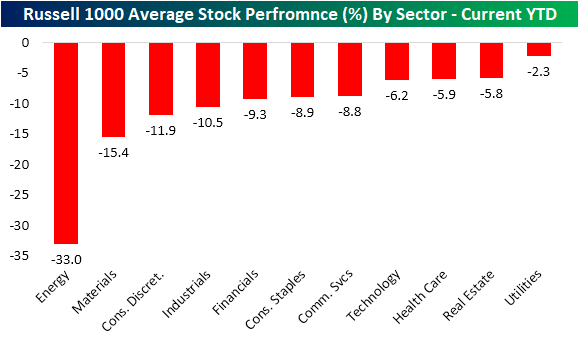
Since the 2/19 high for the US equity market, the average stock in the Russell 1,000 is down well over 10%. The average Energy stock is down the most at -21%, followed by Communication Services and Technology at -13%. Consumer Staples stocks have performed the best with an average decline of 8.9%.

This leaves every sector down year-to-date. Utilities have generally outperformed only falling 2.3%, but the sector is sitting on a loss nonetheless. Of the worst sectors, Industrials, Consumer Discretionary, Materials, and of course Energy have fallen 10% or more. Start a two-week free trial to Bespoke Institutional to access all of our research and interactive tools.
Bespoke’s Morning Lineup – 2/28/20 – Here We Go Again
See what’s driving market performance around the world in today’s Morning Lineup. Bespoke’s Morning Lineup is the best way to start your trading day. Read it now by starting a two-week free trial to Bespoke Premium. CLICK HERE to learn more and start your free trial.
Futures are lower once again this morning as the S&P 500 is now on pace for its 7th straight day of declines. The VIX also continues to rise as it traded above 47 earlier this morning. That’s a level that hasn’t been seen since February 2018. Given the lack of precedent for events related to the Covid-19 shock, there’s just no way to know where this collapse in stocks will end even though numerous market indicators have reached levels that would suggest a bounce is overdue.
Read today’s Bespoke Morning Lineup for the latest stock-specific events, the latest on the coronavirus, and a look at some positive economic data out of Europe.

There’s been a lot of talk in the last week that political factors like the rise of Bernie Sanders in the polls have been an overlooked factor impacting the market this week. People citing this factor have pointed to the weakness in the Health Care sector this week. We’re not sure what data these people are looking at, but the Health Care sector has been one of the better-performing sectors this week. It’s also one of just four sectors that’s not down 10% week to date!

When it comes to where sectors are trading relative to their trading ranges, it doesn’t get much more oversold than things are right now. The chart below is from page two of the Morning Lineup and as you can see, all but two sectors (Technology and Utilities) are more than three standard deviations below their 50-day moving averages.

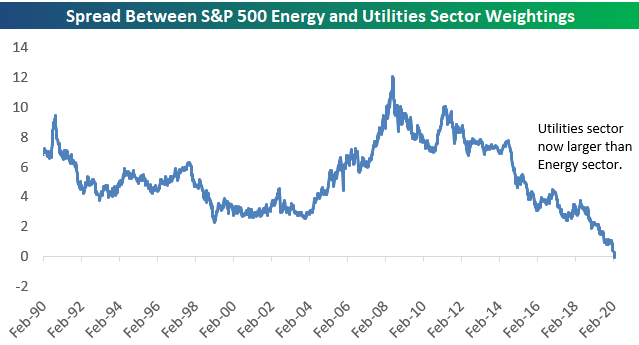
Utilities Now Larger Than Energy — S&P 500 Sector Weightings
The Energy sector continues to get smashed. The sector was already massively underperforming before coronavirus emerged, but since February 19th when the outbreak decided to start panicking markets around the world, Energy has fallen more than 17%. That’s nearly a fifth of the sector’s value in less than ten days!
Remarkably, the Energy sector’s weighting in the S&P 500 has now fallen to just 3.5%. This leaves Energy as the third smallest sector of the S&P 500, with the Utilities sector over-taking it in fourth.

Below is a chart showing the Energy sector’s S&P 500 weighting back to 1990. Talk about a disaster.

At its peak in June 2008, the Energy sector was the 2nd largest in the S&P 500 and less than 70 basis points away from Technology in first. Below is a pie chart showing sector weightings back then. Energy in mid-2008 was one of the three most impactful sectors on performance along with Tech and Financials.
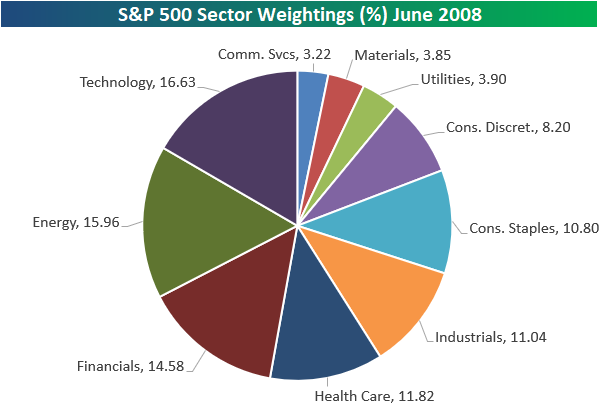
Fast-forward to today, and the current pie chart of S&P 500 sector weightings shows that Energy barely moves the needle.

Below are charts comparing the weightings of the Energy and Utilities sectors back to 1990. This week is the first time in at least the past 30 years that Utilities has had a larger weighting in the S&P 500 than the Energy sector. Become a Bespoke Premium member to view Bespoke’s most actionable analysis. Start a two-week free trial now!