No Commercial Paper Credit Crunch
While financial markets have suffered major turmoil in 2020, at least commercial paper markets are open. Short-term debt issued by non-financial companies, banks, and securitizations of other assets in aggregate sits at about 2.5% of the level it recorded to end last year. Asset-backed issuance is up, while other categories are down, but the broad trend is for little change. This indicates that short-term funding markets may have been disrupted, but they’re still providing plenty of capital to borrowers. Fed programs to support money markets generally and commercial paper specifically have helped as well.
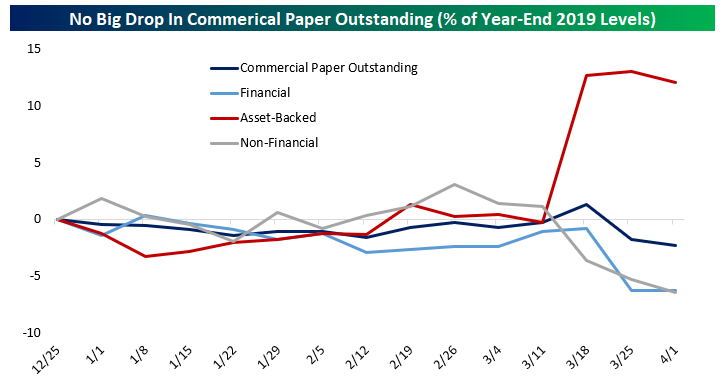
Compare the relative stability of commercial paper issuance year-to-date with the period of the global financial crisis between 2007 and 2009. As shown in the chart, asset-back commercial paper issuance peaked in 2007 and was falling sharply by Q4 of that year. Other categories were also in significant decline by late 2008 and that continued into 2009. Start a two-week free trial to one of Bespoke’s three premium memberships to see our best and most actionable market analysis.

Semis Holding Up Relative to Market
In a post yesterday, we noted that the relative strength of semiconductors versus energy had finally eclipsed its record high from the dot-com boom in March 2000. Semis have not only exhibited relative strength versus the energy sector; they’ve demonstrated strength versus the broader market as well. Take the relative strength of the Philadelphia Semiconductor Index (SOX) versus the S&P 500. In the early stages of the market decline from the February highs, semiconductors saw a sharp drop in their relative strength, but in late March, the SOX surged relative to the broader market and actually hit a record high on March 24th. With Technology playing an increased role in the stay-at-home and work-from-home economy, it makes sense that semis would hold up relatively well.
From that high on 3/24, we saw a modest pullback in the strength of the semis relative to the S&P 500, which then bounced again in recent days. Going forward, the key for the semis is over which level it breaks first. Will it be the March high or the short-term low three days later on 3/27 that followed. Whichever way it breaks will likely dictate which way the broader market goes as well.

B.I.G. Tips — Walmart (WMT) Outperforming Target (TGT)
Bespoke Stock Scores — 4/7/20
Country ETF Checkup
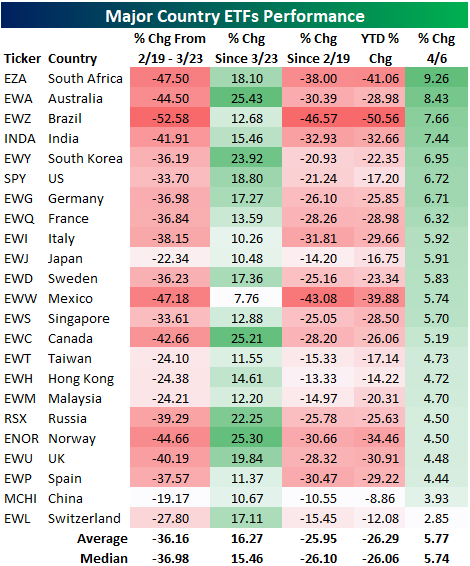
As we noted last night, yesterday’s rally was strong across each of the different industry groups. That also holds true across various geographies. The table below shows the performance of the ETFs tracking the various countries in our Global Macro Dashboard. Like the US, many global equity markets have fallen dramatically over the past couple of months but have seen sizable rallies averaging a gain of 16.27% more recently. Australia (EWZ), Canada (EWC), and Norway (ENOR) have risen the most since the US’s 3/23 bottom, each rising over 25%. That is after a strong session yesterday where some of the top performers were those that had fallen the most from 2/19 through 3/23 like South Africa (EZA), Australia (EWA), and Brazil (EWZ). As for EWZ, it had fallen the most significantly from 2/19 through 3/23 (over 50%) which still leaves it down the most YTD and since 2/19 even after its 12.68% rally since 3/23. On the other hand, another one of the worst performers during the initial sell-off, Mexico (EWW), has seen the smallest rally since 3/23 only rising 7.76%. Despite the smaller rally, it is still down less since 2/19 and YTD than Brazil. Start a two-week free trial to Bespoke Institutional to access our Global Macro Dashboard, Trend Analyzer, Chart Scanner, and more.
Bespoke’s Morning Lineup – 4/7/20 – And Then There Was One
See what’s driving market performance around the world in today’s Morning Lineup. Bespoke’s Morning Lineup is the best way to start your trading day. Read it now by starting a two-week free trial to Bespoke Premium. CLICK HERE to learn more and start your free trial.
Global equties are in major rally mode as the S&P 500 tracking ETF is now trading up over 10% versus its close on Friday. We would also note that volumes have been on the high side as well. Yesterday’s rally was fueled by optimism over flatter curves. Not yield curves but pandemic curves. With little in the way of economic data today, the focus will likely continue to be on case counts out of Europe, New York, and other areas of the country.
Read today’s Bespoke Morning Lineup for a discussion of the latest trends and statistics of the outbreak and an analysis of the factors driving stocks in Europe in today’s rally.

Yesterday we mused that if the early gains held we could see a day where the S&P 500 and none of its sectors closed the day at oversold levels. Well, we got close, but couldn’t quite make it. While most sectors moved out of oversold levels yesterday, Financials had to be the Debbie Downer finishing the day just barely at oversold levels. Let’s hope today’s early gains hold and even the Financials can move into the neutral zone. Even with the S&P 500 and every sector moving out of oversold territory, though, we would note that neither the S&P 500 nor any sectors are trading above their 50-day moving averages. So, even with the recent gains, the market has a sizable hole to dig itself out of.

The Closer – An Excuse to Look on the Bright Side – 4/6/20
Log-in here if you’re a member with access to the Closer.
Looking for deeper insight on markets? In tonight’s Closer sent to Bespoke Institutional clients, we take a look at the S&P 500’s break above resistance also reviewing what happened with the VIX and crude oil. We then take a look at performance based on changes in earning estimates, valuations, and performance during the worst of the sell-off. Next, we show the huge rally for high yield bonds before delving into the latest in Fed stimulus. We close out tonight with a review of today’s 3 year auction.

See today’s post-market Closer and everything else Bespoke publishes by starting a 14-day free trial to Bespoke Institutional today!
Which Industry Groups Bounced the Most Today?
It was a strong day on Wall Street as every industry group finished the day higher with many posting big gains on the session. Consumer Services and Automobiles & Components both rose double digits with Consumer Durables & Apparel and the Semis not far behind. Despite that large rally, the auto industry is the group that is currently furthest from its levels on the 2/19 high and is posting the largest YTD loss. Its performance is even slightly worse than that of Energy which was the biggest loser during the worst of the sell off.
Contrary to the strong performance for autos today, Energy, which fell over 50% from the February 19th peak to the March 23rd bottom, rose about the same amount as the Food & Staples Retailers which only fell 11.4% during the sell-off and remains the closest industry group to its 2/19 levels. Since the market bottomed on March 23rd, the Energy sector has risen the most at 33.17%. Even with that rally, it is down the second most (47.19%) year to date. Start a two-week free trial to Bespoke Institutional to access all of our research and interactive tools.

Daily Sector Snapshot — 4/6/20
Semis vs Energy – A New High
The last several weeks have been a tough time for just about every sector of the market. While there have been some individual stock winners, every major sector is down and down sharply. Some groups have held up better than others, but no area has been spared. We’ve written a lot over the years about how semiconductors are the lifeblood of the 21st-century economy. Semis are ubiquitous in every facet of our lives and in this stay-at-home and work-from-home world the COVID-19 outbreak has thrust upon us, the statement has never been more true.
At the same time that semis have seen a more prominent role in the economy, oil, which was arguably the life-blood of the 20th-century industrial economy, has seen its role diminished even more than it had already been. With everyone working from home, there’s barely a car on the road. Just look at this chart showing the speed of evening commutes across US cities during the week of 3/20 relative to the week before. Commute times are faster in just about every major city and in some cases much faster. Keep in mind too that this is data as of 3/20, and there are even fewer cars on the road now.
Given the acceleration of an already emerging trend, we wondered how this shift has been showing up in the market. Since the S&P 500’s record high on 2/19, the SOX index of semiconductor stocks has dropped just under 20%. That’s a pretty horrific decline in such a short period of time, but it’s less than half of the decline of the Energy sector which is down over 40%! The chart below compares the relative strength of the Philadelphia Semiconductor Index (SOX) to the Energy sector going back to the early 1990s. In the chart, a rising line indicates that the semis are outperforming energy, and vice versa for a falling line. On the right side of the chart, we have also enlarged the period since the start of 2019 so you can see more detail.
What’s really notable about this chart is that in just the last two weeks, the relative strength of the SOX has hit a record high after first overtaking the prior record high from March 2000. Just a few months ago, it seemed like it would be years before the relative strength of the SOX would ever eclipse the record high it made at the peak of the dot-com bubble. At that time, no one would have guessed that the catalyst for taking the SOX over the hump would be the swiftest bear market in history! Start a two-week free trial to one of Bespoke’s three membership services to see our best and most actionable market analysis.
