Inflation Data Catching Up to ISM Commodities Survey
In each month’s ISM reports, respondents are asked which commodities they have seen price increases and decreases in, as well as which ones are in short supply. Over the years, we have highlighted trends in this survey as they have often been a good leading indicator of overall trends in inflation. The chart below compares the y/y change in CPI versus the six-month average of the net combined number of commodities up in price in the ISM Manufacturing and Services reports. All the way back in late 2018, the average net number of commodities rising in price peaked and started to decline from readings in the 30s. While this reading was on the decline, overall inflation, as measured by y/y CPI, wouldn’t budge below 1.5%. While it took a global pandemic, the lower prices implied by weaker commodity prices finally flowed through to inflation readings in the last few months as y/y CPI is barely above zero and at levels not seen in nearly five years.

While overall price levels may be rising a lot more slowly, the number of commodities in short supply is coming off levels not seen in at least 20 years. The chart below shows the number of commodities reported as being in short supply in the monthly ISM Manufacturing and Non-Manufacturing reports. In this month’s reports for the month of May (reported last week), the total number of commodities in short supply was at 29, which was down from April’s record reading of 33.
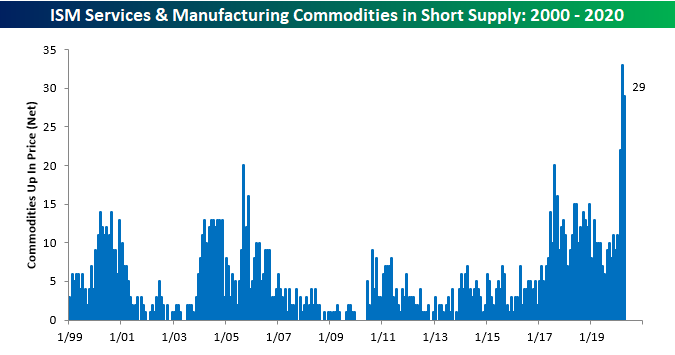
Given the basic laws of supply and demand one would think that with a record number of commodities in short supply, inflation pressures would be rising rather than falling. So, what gives? The table below lists the commodities that are currently noted as being in short supply along with which report(s) they were noted in. As you can see, just about all of these commodities are related to the COVID outbreak, and while their prices have surged in the last few months, as a percentage of the overall inflation picture, they still take up a small share of the overall pie. In other words, shortages are rampant in one sector of the economy, but it’s a very small slice. Click here to view Bespoke’s premium membership options for instant access to our research and analysis.

Big Tech Breakout
As we noted yesterday, the Consumer Discretionary sector (XLY) was the first and only sector above its 2/19 levels (date of the last all-time high for the S&P 500). But with further gains yesterday, Technology (XLK) is looking to join XLY in moving above its 2/19 levels. On a closing basis, XLK finished yesterday $0.15 above its last all-time high. While the ETF has broken out slightly, the same cannot be said just yet for the S&P 500 Technology index that the ETF tracks which finished yesterday still 0.2% below its highs; the closest to its 2/19 high of any sector excluding Consumer Discretionary. Communication Services, Materials, and Health Care are likewise within tangible reach of their prior highs.

Within the Tech sector, there are several stocks that have begun to break out as well. As shown in the charts below from our Chart Scanner, there are some like Apple (AAPL), Adobe (ADBE), Microsoft (MSFT), OneSpan (OSPN), and Texas Instruments (TXN) that have broken out to or are very close to new 52-week highs after taking out their highs from earlier this year within the past several days. Though they are not at 52-week highs, there are others like Advanced Micro Devices (AMD) and Hewlett Packard (HPE) which are experiencing other types of breakouts. For AMD, the stock was quick to recover most of its 2/19 to 3/23 losses retesting those prior highs as early as mid-April, though, it had done so unsuccessfully. Ever since AMD has been in a short term downtrend as Tech shifted from a market leader to somewhat of a laggard in the past month. But surging 6.5% yesterday and another 2.87% today, the stock has broken that downtrend. HPE on the other hand had peaked last fall with losses accelerating during the bear market. Since March, the stock has not shared the massive recovery of other stocks as it has consolidated between roughly $9 and $10.5. In just the past week, though, HPE has managed to break out above this range.
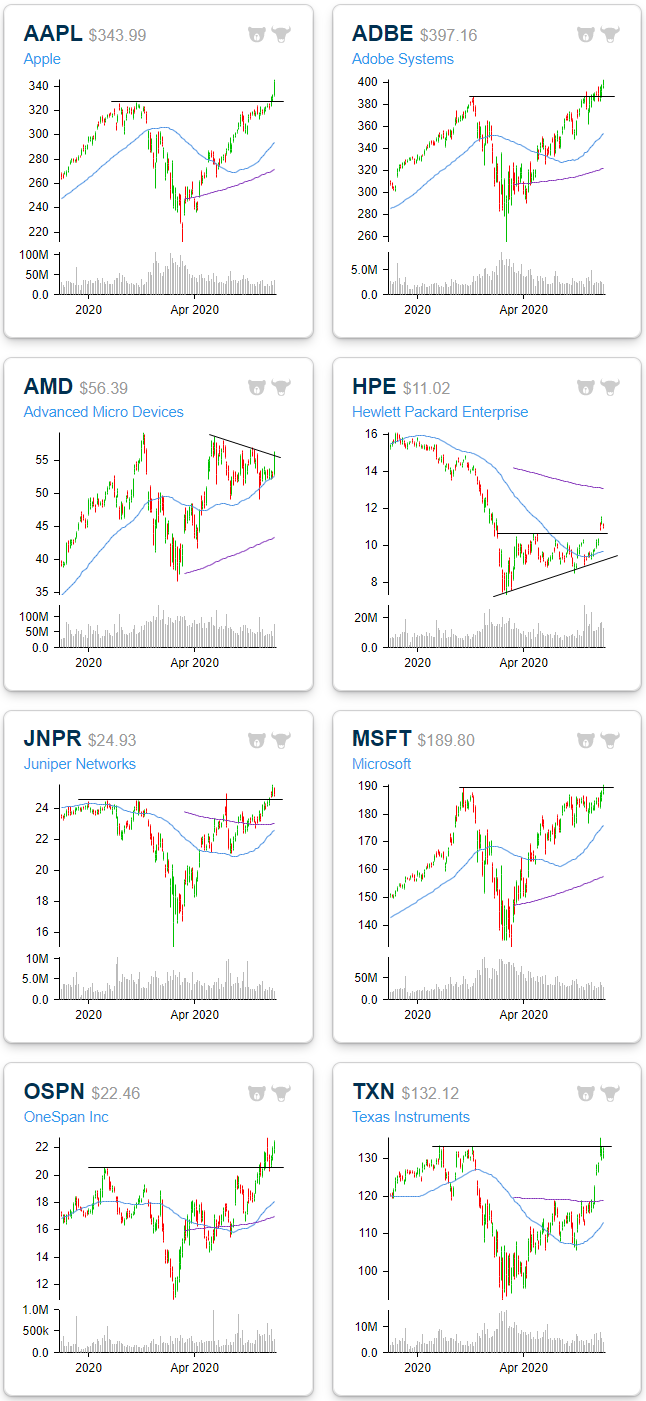
As previously mentioned, AAPL has experienced a significant breakout in the past week and the same can be said for other mega-cap stocks as well. Of the FAANG stocks, Amazon (AMZN) also broke out (again) yesterday to its own 52-week high. Facebook (FB) has nearly done the same after successfully retesting former resistance around $223 in the past couple of weeks. At the same time, Netflix (NFLX) has held up at its 50-DMA while Alphabet (GOOGL) has moved back into its range from earlier this year leading up to its 2/19 high. Click here to view Bespoke’s premium membership options for our best research available.

Bespoke’s Morning Lineup – 6/10/20 – Mortgages Still Ripping
See what’s driving market performance around the world in today’s Morning Lineup. Bespoke’s Morning Lineup is the best way to start your trading day. Read it now by starting a two-week free trial to Bespoke Premium. CLICK HERE to learn more and start your free trial.
After a relatively large dip lower right around the time Europe opened for trading, today was looking like it was going to be some sort of repeat of Tuesday’s action when pre-market gains in the futures were erased after Europe opened. At their 6:00 AM eastern lows, futures were down over 1% from their overnight highs, but since then they have rallied back more than 0.70% and firmly back in positive territory. The initial cause of the dip was a report from the OECD that estimated global growth would decline 6.0% this year and even more if a strong second wave of the virus emerges in the Fall and Winter. Tell us something we don’t know.
CPI for May was just released and while economists were expecting both the headline and core readings to come in unchanged versus April, they both showed a 0.1% m/m decline.
Be sure to check out today’s Morning Lineup for a rundown of the latest stock-specific news of note, the rally in iron ore and copper, credit creation data in China, global and national trends related to the COVID-19 outbreak, and much more.

We’ve been highlighting the trend for a couple of weeks now, most recently in last Friday’s Bespoke Report, but mortgage purchase applications continue to rip higher. The latest figures released this morning confirmed that trend as overall applications increased 9.3% while purchase applications increased 5.3%.
With this past week’s increase, purchase applications have now increased for a record eight straight weeks. Even more impressive is the fact, that the index for purchase applications is just a whisker below the 10+ year high of 313.7 from back in January. Historically low rates are fueling what looks like an extremely strong housing market.

Daily Sector Snapshot — 6/9/20
Valuations Stretching
With equities recovering a massive share of the declines from earlier in the year, valuations have gotten a bit elevated. As shown in the chart below, the trailing price to earnings ratio of the S&P 500 is now in the 99th percentile of the past decade. At the moment, the S&P 500’s P/E ratio of 22.5 is the highest since January and February of 2018. Prior to that, the last time that the S&P 500 had a P/E around this elevated level was in late 2009 and it was even more elevated in the late 1990s/early 2000s. As for the individual sectors, Technology is also in the 99th percentile of the past decade’s range with the only higher readings being in February of this year right around the time of the last all time high for the S&P 500. Consumer Discretionary is trading at even more of a premium. Its 33.4 P/E is at its highest level since September of 2009 after rocketing higher over the past few weeks. As for the other sectors, Communication Services is the only other sector in the 90th percentile or better of the past decade while Health Care, Real Estate, Industrials, and Materials are all in the 75th percentile or higher. Financials and Utilities have more modest valuations on a P/E basis in the 39th and 57th percentiles, respectively.

For the sectors like Consumer Discretionary, Communication Services, and Technology as well as the S&P 500 itself, these premiums are similar to earlier this year at the last all time high on 2/19 (second chart below). Back then, all of these sectors were trading in the 99th or 100th percentile of their 10 year range. Utilities was another sector with an elevated valuation, but fast-forwarding to today, its valuation is much more modest. Other sectors like Real Estate and Consumer Staples are similarly at less of a premium than back on 2/19.

Additionally, valuations are appearing a bit stretched relative to their 10 year range on a price-to-book basis. In the past ten years, the S&P 500 has only had a higher PB ratio (currently 3.66) earlier this year in January and February. Prior to that you would need to go back to the late 1990s around the dot com bubble to find a higher PB ratio for the index. Meanwhile, the PB ratios of Consumer Discretionary, Health Care, and Technology are at their highest levels of the past 10 years. Energy on the other hand is still at the low end of the past decade’s range similar to Materials and to a lesser extent Financials. Click here to view Bespoke’s premium membership options for our best research available.

Back in November of last year through February of this year, the S&P also had its price to book, similar to its price to earnings, at the high end of the past ten years’s range. Yesterday marked the first time that the PB ratio was in the 99th percentile of the past ten years without another occurrence in the prior 60 days since November of last year. For the PE ratio it was the first time since February. As shown in the tables below, for the PB ratio that is also only the sixth time that has happened since 2000. Following such occurrences, the S&P 500 has leaned towards weaker than normal performance, especially in the short term (week and month). Although a very small sample size, the same can also be said for the price to earnings ratio. Click here to view Bespoke’s premium membership options for our best research available.

Bespoke Stock Scores — 6/9/20
Chart of the Day – Emerging Markets Slice Through 200-DMA
B.I.G. Tips – Recession Calls vs Market Performance
The National Bureau of Economic Research (NBER) made it official and said that the longest economic expansion in US history ended in February at a record 128 months. While the NBER typically defines a recession as lasting “more than a few months,” it noted in the release that the pandemic caused a “downturn with different characteristics” than prior recessions. It went on further to say that the scope and magnitude of the decline in economic activity warranted the designation of a recession even if it ends up being shorter than the traditional definition of a recession or any other one for that matter.
Now that the NBER has made the recession official, as an investor, should you care? In a report just published, we looked at prior periods where the NBER formally declared a recession had started and looked at S&P 500 performance leading up to and after prior recessions announcements. For anyone looking for answers in how the NBER’s recession call could impact market performance, this report is a must-read. To see it, sign up for a monthly Bespoke Premium membership now!
Sectors Not Positive YTD Yet
In addition to the Nasdaq reaching a new all time high, the big news yesterday was the S&P 500 turned positive on the year; albeit not by much at only 5 bps. That is a far cry from where things stood just under 3 months ago. On the bear market low on March 23rd, the S&P 500 was down 30.75% YTD. Five sectors were down even more with Energy being the worst of these at a 60.34% loss. On the other hand, Consumer Discretionary, Health Care, Communication Services, Technology, and Consumer Staples were down less than 30% at the lows on 3/23.

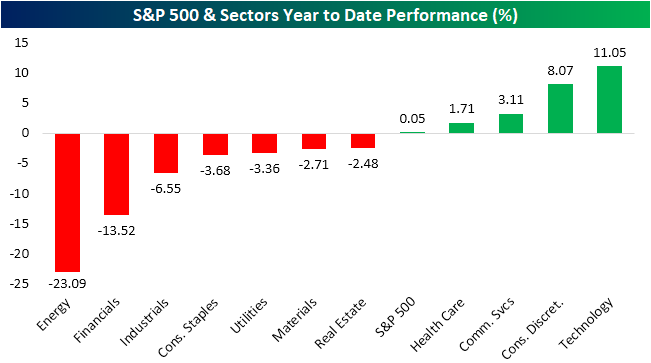
Turning to today, while the broader index closed Monday in the green, less than half of the individual sectors are sitting on a gain YTD. Health Care, Communication Services, Consumer Discretionary, and Technology are all positive YTD. Of these, Tech is up the most at 11.05%. Consumer Discretionary also boasts a sizeable gain of 8.07%, while Health Care and Communication Services are both up less than 4%. While over half of the eleven sectors are still sitting on a loss YTD, for most it is not by much. Four of the seven that are in the red—Consumer Staples, Utilities, Materials, and Real Estate—are all within 5% of the flat-line. Meanwhile, Energy and Financials are still well below their levels at the start of the year, down 23% and 13.5% respectively.
While the YTD gain milestone has been reached (though not holding just yet), bulls still have more work to do to reach levels from the last all time high on 2/19. The S&P 500 closed yesterday within 5% of that 2/19 high and Communication Services, Materials, Tech, and Health Care are also within a few percentage points of those levels. Other more hard hit sectors like Energy, Utilities, and Financials are much further below; all double digits below their 2/19 levels. Conversely, as of yesterday’s close, only Consumer Discretionary has managed to move above its 2/19 levels. That’s largely due to Amazon’s (AMZN) massive move higher throughout the COVID crisis. Click here to view Bespoke’s premium membership options for our best research available.

Bespoke’s Morning Lineup – 6/9/20 – Turnaround Tuesday (The Wrong Way)
See what’s driving market performance around the world in today’s Morning Lineup. Bespoke’s Morning Lineup is the best way to start your trading day. Read it now by starting a two-week free trial to Bespoke Premium. CLICK HERE to learn more and start your free trial.
What always seems like a great idea late one night, rarely looks good the next morning, and that’s what’s happening for a lot of stocks today. Many low to no quality stocks that were bid sharply higher yesterday, even after rallying to levels they probably had no business trading at, are down sharply this morning. The poster child for the move is Chesapeake, which is trading down over 40% after nearly tripling on Monday. Even with the pre-market declines, though, CHK is up more than 177% from Thursday’s close!
Be sure to check out today’s Morning Lineup for a rundown of the latest stock-specific news of note, European markets, economic data out of Japan, Australia, and Germany, global and national trends related to the COVID-19 outbreak, and much more.
With the S&P 500 poised to gap down just under 1%, we screened our database for prior occurrences where the S&P 500 tracking ETF (SPY) gapped down more than half of a percent after trading up more than 1% the prior day. We then broke out those occurrences by the day of the downside gap and calculated SPY’s average open to close performance on those days. Since 1994, there have been a total of 140 prior occurrences that fit the criteria. On those days, the S&P 500 saw an average rest of day decline of 0.08% with positive returns just under half of the time.
When the downside reversal occurred on a Tuesday (20 prior occurrences), the average rest of day performance was only slightly better at -0.06% with gains 45% of the time. While these results don’t provide much in the way of info for a Tuesday, we can at least be thankful the reversal isn’t occurring on a Wednesday or Thursday where rest of day returns have been the weakest. The only day of the week where SPY saw positive rest of day returns on an average basis was Friday (+0.30%).

