Homebuilder Sentiment Surge
Back in April, like many economic indicators, the NAHB’s reading on the single-family housing market came crashing down. The index bottomed out at 30 which was its lowest level since June of 2012 when the headline number had been 29. May’s reading saw a bit of a bounce as the index rose to 37, but even at those levels, it was still showing similar readings to the late summer of 2012. June, on the other hand, showed a massive improvement for both the overall market index and each of the components and other sub-indices. Now, while still well off the highs from only a few months ago, each index is greatly improved and sitting at the bottom of the past several years’ range.
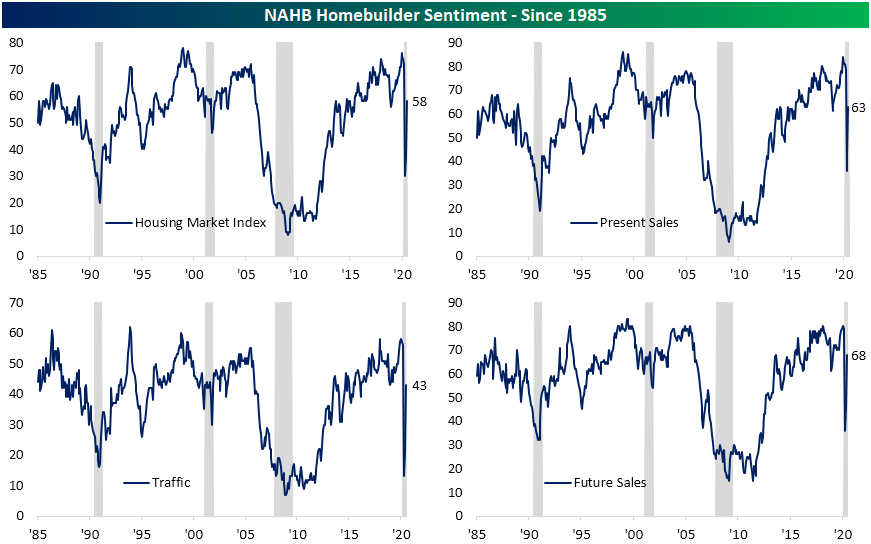
This month’s release also blew estimates out of the water. The headline number had been forecasted to come in at 45 which would have still been a contractionary reading. Instead, the actual number came in 13 points higher at 58. Only two months after the worst miss relative to expectations, today’s 13 point beat was the biggest beat versus expectations since at least 2003.

The headline number, as well as just about every sub-index, also observed their largest one-month increases on record. While those increases did not leave any sub-index at a new high, they are now back into the middle of their historical ranges. Additionally, all but two sub-indices (Traffic and the Northeast) are also now showing readings above 50 meaning homebuilders have a more favorable outlook on the market. Just last month every sub-index showed unfavorable conditions.

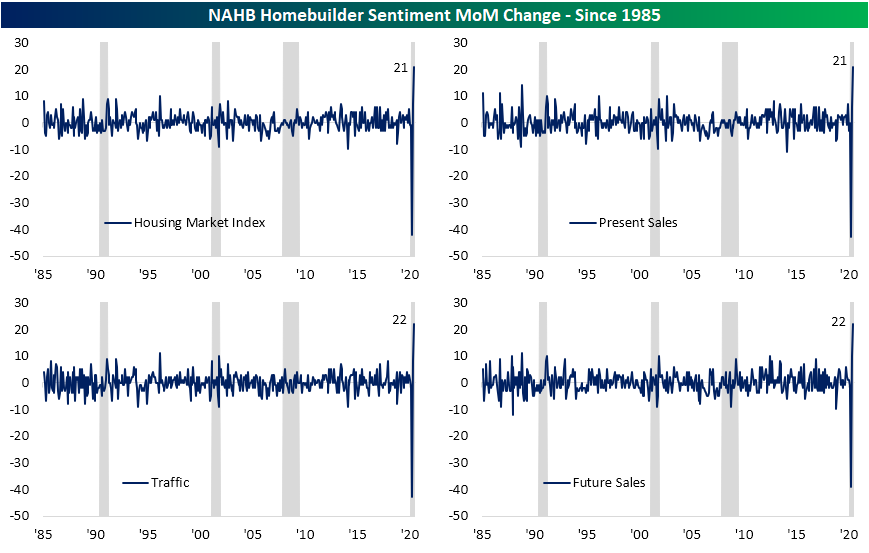
In the charts below, we show the blowout of the month over month changes over the past few releases for the headline index as well as its three components. As previously mentioned, each one experienced its sharpest one month increase on record.
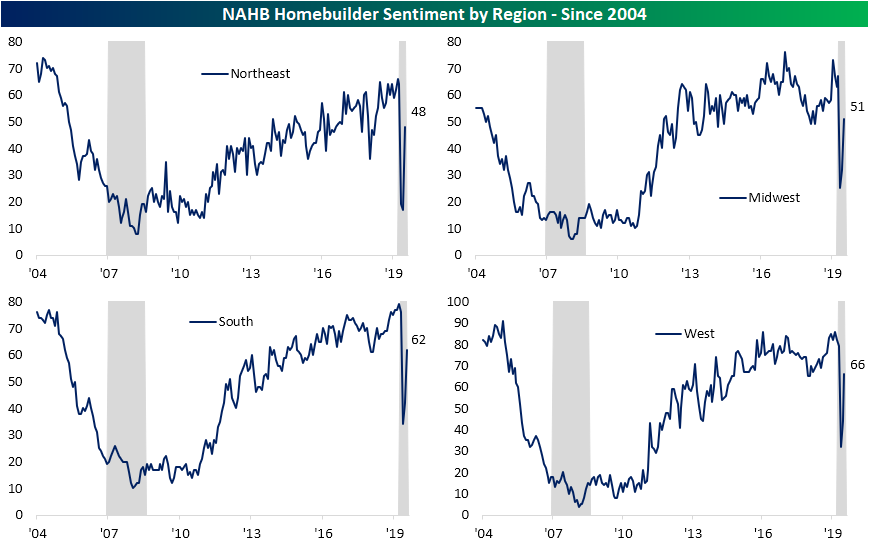
Meanwhile, the same can be said for the indices covering each of the US regions. The only region to not experience a record month over month increase was the West, but even that was its second-largest MoM gain ever. As with the individual categories, most readings are showing more favorable housing markets although the Northeast, like the index for Traffic, remains below 50 (unfavorable market) despite its record uptick. Click here to view Bespoke’s premium membership options for our best research available.

Bespoke Stock Scores — 6/16/20
Off Season Earnings Trends
We’re basically right in the middle of the earnings off-season right now when only a handful of companies are reporting quarterly earnings each day. Bespoke maintains a huge historical database of quarterly earnings reports for nearly every stock traded on US exchanges. Clients have access to the database — called the Earnings Explorer — right on our website. The Earnings Explorer contains a full calendar of upcoming earnings reports, summary charts highlighting historical trends on earnings and revenue beat rates, guidance numbers, and historical quarterly results for individual stocks going back 20 years.
As shown below, the number of earnings reports by day over the next three weeks is minimal, and then the Q2 reporting period starts up in full force in mid-July. Click here to view Bespoke’s premium membership options for our best research available.

Below is a chart from our Earnings Explorer that shows the historical “beat rate” for all stocks that have reported earnings over the last five years. This reading shows the rolling 3-month percentage of companies that have reported stronger than expected EPS and sales numbers. Notably, the bottom-line EPS beat rate had been well above its historical average since late 2017, but it has just recently dipped below its average with a steep decline over the last three months. Conversely, the percentage of companies beating sales estimates has held steady over the last few months and is now higher than it was for all of 2019. Over the last three months, 61.5% of companies have beaten top-line sales estimates, which is five points above the long-term average of 56.5%.

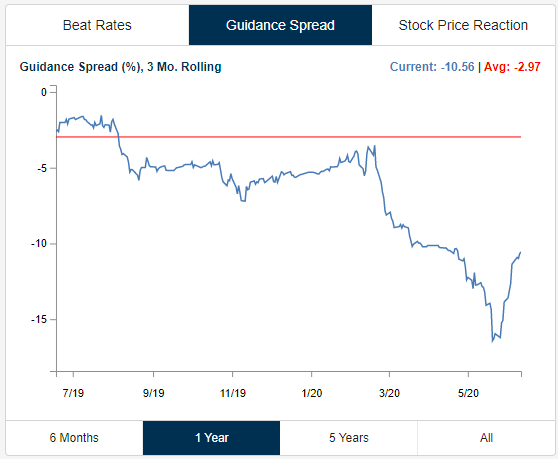
We also monitor the “guidance spread,” which is the difference between the percentage of companies raising guidance and lowering guidance on a rolling three-month basis. As shown, after plummeting from only slightly negative levels as we entered 2020 to -17% at the end of May, the guidance spread has begun to increase quickly in June. Since the reading is still in the red, it means that companies are becoming “less negative” about the future.

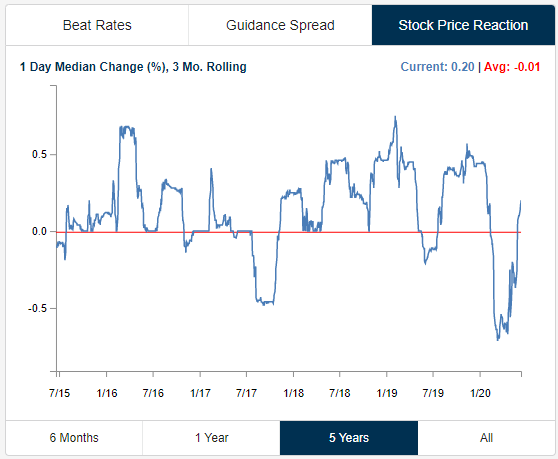
One final indicator that we track is the median one-day percentage change of stocks that report earnings. Over the last three months, stocks that have reported earnings have seen a median one-day share price reaction of +0.20%. As shown below, that’s a huge increase from extremely negative price reactions to earnings that we saw in March and April.

Below we have taken snapshots of two pages from our Earnings Explorer tool that provides snippets of information you can easily review for the stocks you’re most interested in. To try out our Earnings Explorer free of charge, start a two-week free trial to Bespoke Institutional today!


B.I.G. Tips – Retail Sales Rise From the Ashes
For the last several weeks, all we have heard is how Americans have been sitting at home and gambling away their stimulus checks in the stock market. Well, if that’s true, how did they ever find the time or the money to spend like they did in May? Relative to April, Retail Sales rose by a record 17.7%, which was more than double expectations and well more than double the next strongest month back in October 2001.
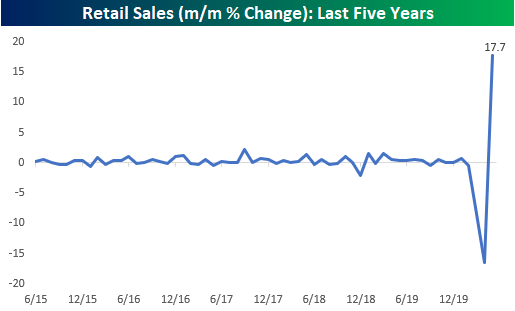
Even after the largest monthly increase on record, Retail Sales remain well in the hole compared to where they were at their highs in January. In fact, through May the pace of sales on a seasonally adjusted basis was still nearly 40% off the highs.

For anyone with more than a passing interest in how the economic shutdown is impacting economic data, our monthly update on retail sales is a must-read. To see the report, sign up for a monthly Bespoke Premium membership now!
Chart of the Day: SPY Gaps Up of 2%+
Bespoke’s Morning Lineup – 6/16/20 – Stimulus Everywhere
See what’s driving market performance around the world in today’s Morning Lineup. Bespoke’s Morning Lineup is the best way to start your trading day. Read it now by starting a two-week free trial to Bespoke Premium. CLICK HERE to learn more and start your free trial.
After yesterday’s rally stunning reversal, which was attributed (wrongly in our view) to the FOMC announcing that it would start buying corporate bonds, global equities are in rally mode again this morning on reports of a $1 trillion stimulus plan scheduled to be unveiled by the Trump Administration for roads, bridges, and technology projects. Futures are at their highs of the morning ahead of what will be a busy day of economic data.
Be sure to check out today’s Morning Lineup for a rundown of the latest stock-specific news of note, the global rally in risk assets this morning, economic sentiment, global and national trends related to the COVID-19 outbreak, and much more.

The chart below from page two of our Morning Lineup report shows the daily overbought/oversold readings of the S&P 500 over the last year. The brief dip into neutral territory following Thursday’s rout didn’t last long as the S&P 500 closed back at overbought levels yesterday and with futures currently up over 3%, we’re only moving further back into overbought levels now.

Daily Sector Snapshot — 6/15/20
Small Bounce For Small Business
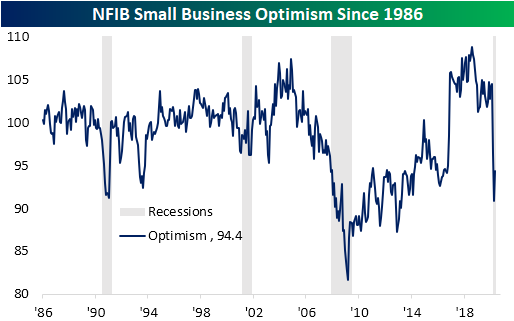
Last Tuesday, the NFIB provided an update on small business sentiment in the month of May. In April the headline number had fallen down to 90.9 which was the lowest level since March of 2013. In May, the index rebounded to 94.4. That 3.5 point increase was the largest one month gain for the index since a 3.7 point increase in November 2017. While an improvement, the index now only remains around similar levels to 2016.
As shown in the table below, breadth in the May report was solid with all but two components of the headline number (Job Openings Hard to Fill and Actual Earnings Changes) rising month over month. Even with the nice bounce, though, there is still a negative net percentage of respondents reporting optimism for credit conditions, inventories, sales, and earnings. Similarly, poor sales have become one of the most pressing issues for businesses.

While current optimism remains at the lowest level of the past several years, the index for expected conditions is more positive. A net percentage of 34% of respondents reported that they expect the economy to be better rather than worse. That is the highest reading since August and July of 2018.

As shown in the charts below, activity indices have been some of the weakest areas of the report. A net of -19% reported sales were higher which was an 8 percentage point drop from the prior month. That is the weakest reading for that index in a decade. Bottom lines are also hurting with a net of 26% of respondents reporting lower earnings. That is a 6 percentage point drop MoM and the weakest level for this index since an equivalent reading in February 2014. NFIB highlighted that the bulk (46%) of owners reported weak sales as a source of the weak earnings while another 9% reported price changes as another reason. Meanwhile, a net 2% reported that they plan to accumulate inventories.

Labor market indices are another weak area. Some of the only indices to experience sequential declines outside of sales and earnings were labor-related. For example, the indices for Compensation, Actual Employment Changes, and Job Openings Hard to Fill all were down from April. Those indices are now at their lowest levels since July 2013, September 2009, and September 2014, respectively. Meanwhile, the outlook is less pessimistic with Hiring Plans and Compensation Plans both ticking higher, though, they too remain at their lowest levels of the past several years.

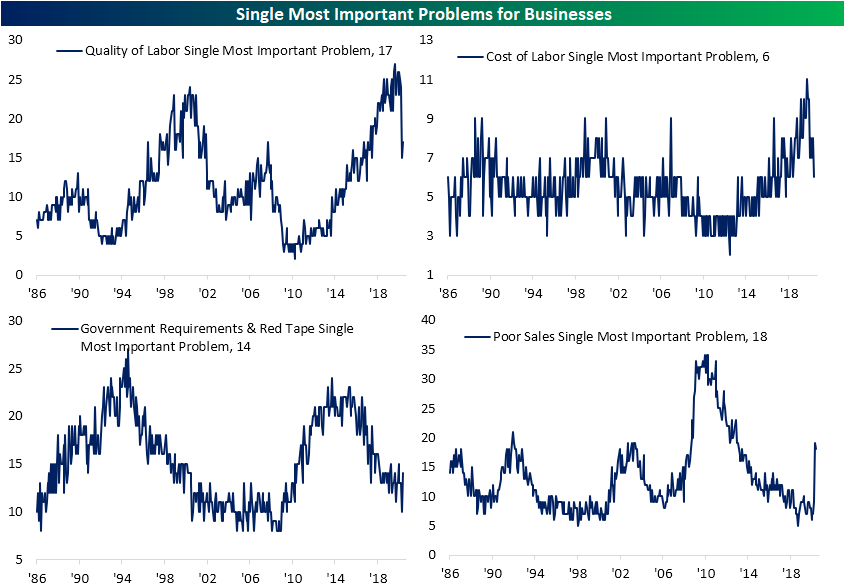
The weakening in labor activity is also showing through what businesses consider their biggest issue. Over the past couple of years, the quality of labor and the cost of labor had become some of the most pressing issues. But that is no longer the case as recent months have seen that trend reverse. Now 18% reported Poor Sales as the most pressing issue while Quality of and Cost of Labor as the most important issue are around similar levels to 2017. The amount reporting poor sales as the most important issue was actually down 1 percentage point in May but it is still elevated at its highest levels since 2013. Additionally, government red tape remains one of the most important issues though that is not at any multiyear high like Poor Sales.
Leading up to the COVID Crash, “poor sales” was at the bottom of the list when it comes to the biggest problems reported for small businesses. You know an economy is firing on all cylinders when that is the case. Conversely, when “poor sales” are the leading issue for small businesses, it obviously represents a major problem. As shown in the lower right chart below, “poor sales” has indeed spiked as a major issue, but it’s still only half of what was seen at the depths of the Financial Crisis. It’s a good sign that this reading actually ticked slightly lower in May versus April, and we’ll continue to watch it closely in the coming months as one of our key indicators for the recovery. Click here to view Bespoke’s premium membership options for our best research available.