B.I.G. Tips – CAT Sales Head South
Who Is Now Overbought?
Over the past couple of weeks, as equities have mean reverted, the vast majority of S&P 500 stocks have moved out of oversold territory. In fact, today there are just two stocks that are oversold: Everest (RE) and Southwest Airlines (LUV). Meanwhile, more and more stocks have gotten extended above their 50-DMAs. At the moment, there are around 16% of stocks in the S&P 500 that are overbought. That is certainly not a large amount of the index, but it is the most we have seen in some time now.

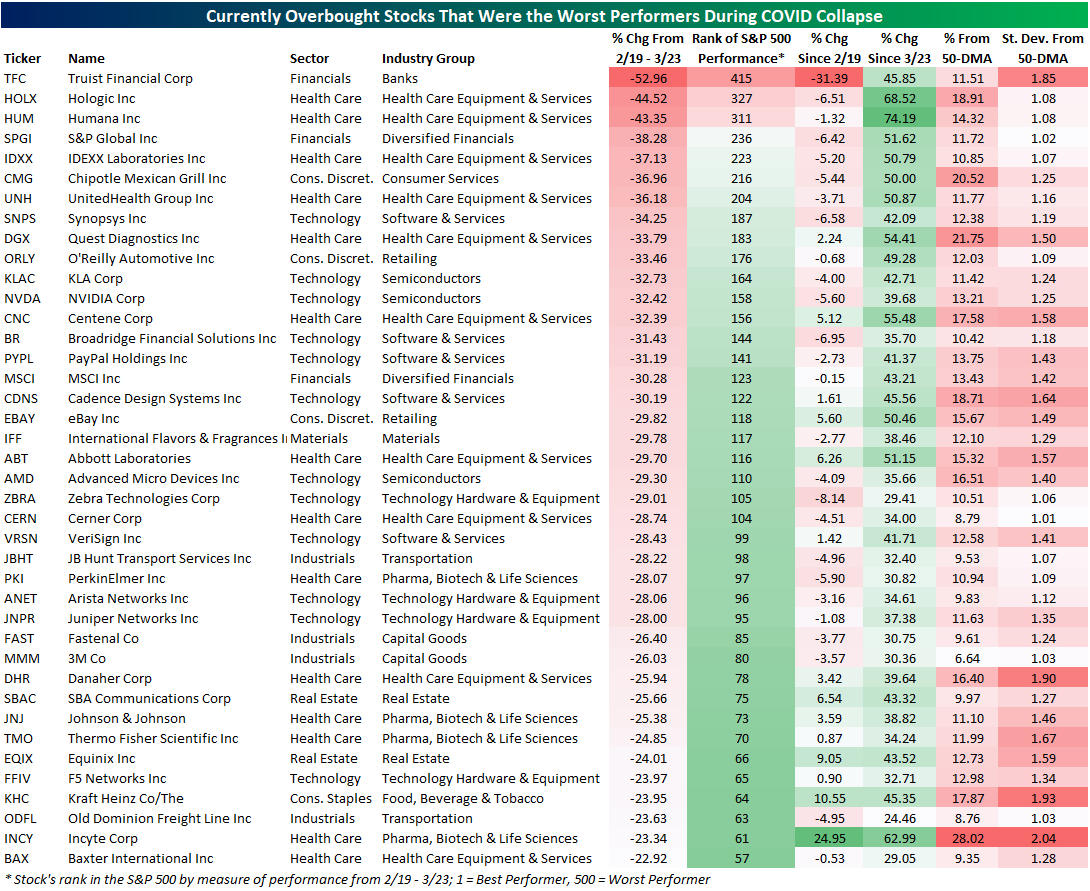
Taking a look across the stocks that are currently overbought, very few of them were those that had gotten hit the hardest from the February 19th peak to the March 23rd low. In fact, of the 100 worst performing S&P 500 stocks in that period, there is only one that is overbought, Truist Financial (TFC), and there are only twelve (including TFC) that have retaken their 50-DMAs. Currently, the median distance from the 50-DMA of those 100 worst performers from 2/19 through 3/23 is 9.31% below their 50-DMA. In other words, the hardest hit stocks during the worst of the sell off have still yet to completely mean revert (more specifically, move back to their 50-day average).
As for the stocks that have mean reverted and are now looking a bit extended (at least 1 standard deviation above their 50-DMAs), most were of the better performing half of the S&P 500. In the table below, we show the 40 names that were hit the hardest during the sell off from 2/19 through 3/23 out of the 77 S&P 500 stocks that are currently overbought. While these are the worst hit of the currently overbought stocks, most of these were actually some of the strongest performers of the broader S&P 500 during the sell off though that does not mean they were totally immune from massive declines. For example, 17 of these stocks were in the top 100 best performers during the sell off. On the other hand, only three stocks, Truist Financial (TFC), Hologic (HOLX), and Humana (HUM) were in the bottom performing half of the index during the sell off. The massive rebounds that these names have staged has led them to their current overbought levels. Overall, due to the size of the massive declines in February and March, the hardest hit stocks in the S&P 500 have rallied considerably but have not yet reached overbought territory so much as even retaken their 50-DMAs. That means that many of the least hard hit stocks are the ones that have first reached and are currently sitting in overbought territory. Start a two-week free trial to Bespoke Institutional to access our full range of research and much more.
Bespoke Stock Scores — 4/28/20
Chart of the Day – Consumer Confidence Craters
More and More Equity Market ETFs Back Above Their 50-DMAs
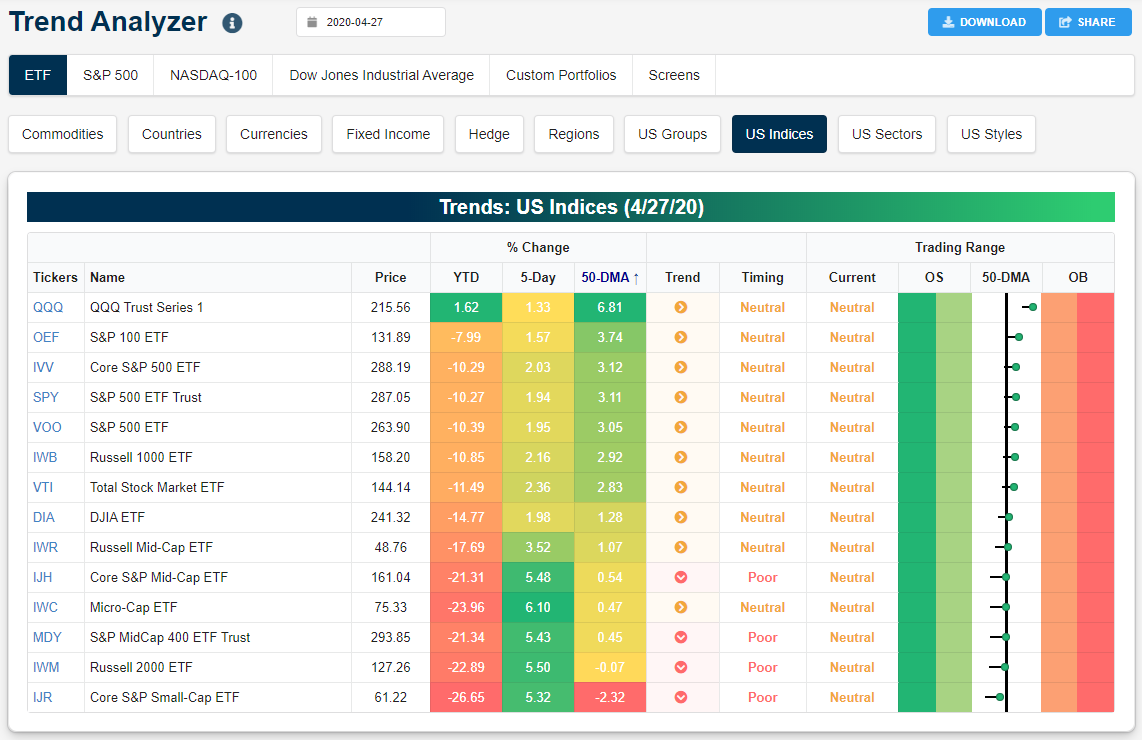
It hasn’t been talked about much but the Nasdaq 100 (QQQ) remains up on a year-to-date basis with a 2020 gain so far of 1.62%. Below is a snapshot of QQQ and other major US index ETFs run through our Trend Analyzer tool that’s available to Bespoke Premium and Bespoke Institutional members. Note that all but two of these index ETFs have now moved back above their 50-day moving averages, which often acts as a key support/resistance level. The Nasdaq 100 (QQQ) is the farthest above its 50-DMA at +6.81%, followed by the S&P 100 (OEF) and the three main S&P 500 ETFs (IVV, SPY, VOO). The Total Stock Market ETF (VTI) is 2.8% above its 50-DMA, while the mid-cap ETFs like IWR, IJH, and MDY are all just slightly above their 50-DMAs. While the Micro-Cap ETF (IWC) is above its 50-DMA, the two main small-cap ETFs (IWM, IJR) are the ones that remain slightly below. Start a two-week free trial to Bespoke Institutional to access our interactive economic indicators monitor and much more.
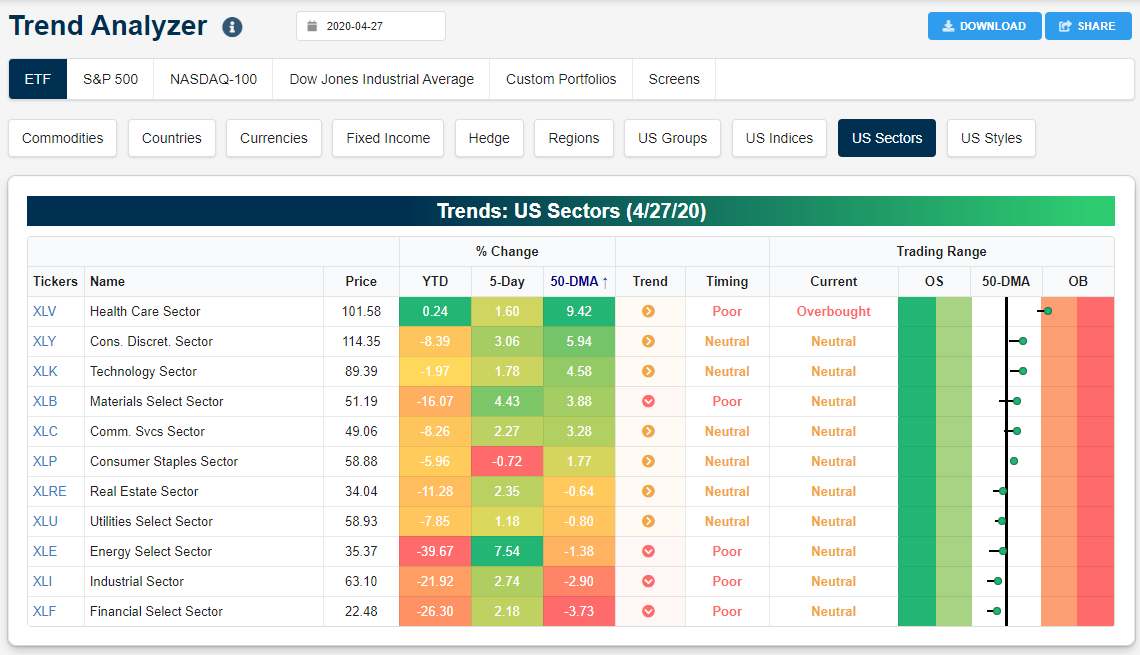
Below is a snapshot of the main S&P 500 sector ETFs from our Trend Analyzer tool. While almost all of the broad US index ETFs are back above their 50-DMAs, only six of eleven of the sector ETFs have re-taken them. The Health Care sector (XLV) is the farthest above its 50-DMA at +9.42%, and Health Care is the only sector that is now trading in overbought territory. It’s also the only sector that’s up year-to-date, similar to QQQ. Consumer Discretionary (XLY), Technology (XLK), Materials (XLB), Communication Services (XLC), and Consumer Staples (XLP) are the other five sectors above their 50-DMAs.
On the downside, the Energy sector (XLE) is no longer the farthest below its 50-DMA; that title now belongs to Financials (XLF) which is 3.73% below. The Industrials sector (XLI) is 2.9% below its 50-DMA, followed by Energy (XLE) at -1.38% and Utilities (XLU) at -0.80%.
While Health Care is up on the year, three sectors — Energy, Industrials, and Financials — are still down more than 20% year-to-date. Gain access to our Trend Analyzer tool and our daily investment research with a two-week free trial to Bespoke Premium.
Bespoke’s Morning Lineup – 4/28/20 – A First Since February
See what’s driving market performance around the world in today’s Morning Lineup. Bespoke’s Morning Lineup is the best way to start your trading day. Read it now by starting a two-week free trial to Bespoke Premium. CLICK HERE to learn more and start your free trial.
The S&P 500 is looking to make it three in a row today. Not just three positive days in a row, but three straight days of gains of at least 1%. There’s still an entire trading day left to go, so given the positive bias at the outset, today is a day where we don’t want Tuesday to live up to its ‘turnaround name’.
On the earnings front, keep in mind that the five largest companies in the S&P 500 are set to report over the next three days. Here is a write-up we did highlighting their historical Q1 earnings trends.
Five Largest Market Caps Report This Week — AAPL, AMZN, FB, GOOG, MSFT
Be sure to check out today’s Morning Lineup for a rundown of the latest earnings reports, the latest moves in crude oil, economic data out of Japan and South Korea, and the latest data on the coronavirus outbreak.

Yesterday marked a key milestone in the equity market’s rally off the late March lows. You may have to squint to see it in the chart, but it was the first time since 2/21 that the S&P 500 opened above its 50-day moving average and stayed there the entire trading day. That’s certainly a positive, but it isn’t completely blue skies ahead. As shown in the chart, the next area of resistance for the market here is just above 2,900, and then after that the 200-DMA at just above 3,000.

The chart below is from the second page of our Morning Lineup and shows where the S&P 500 is trading relative to its trading range as measured in standard deviations. It’s been a big run in the last few weeks as the S&P 500 has recovered nearly as fast as it fell. From here, the best thing for the bulls would be for the market to hang around these levels and build a base at which it could build on later.

Five Largest Market Caps Report This Week — AAPL, AMZN, FB, GOOG, MSFT
The earnings slate ramps up in a big way this week. Included in the 784 total companies reporting this week are the five largest stocks in the S&P 500. As shown below, Alphabet (GOOG) will kick things off tomorrow followed by Facebook (FB) and Microsoft (MSFT) on Wednesday and Amazon (AMZN) and Apple (AAPL) Thursday evening.

Our Earnings Explorer tool lets users conduct in-depth analysis of individual companies and how their share prices typically react to quarterly results. Below we highlight the ins and outs of quarterly earnings for the five largest stocks in the S&P 500 — all of which report Q1 results this week.
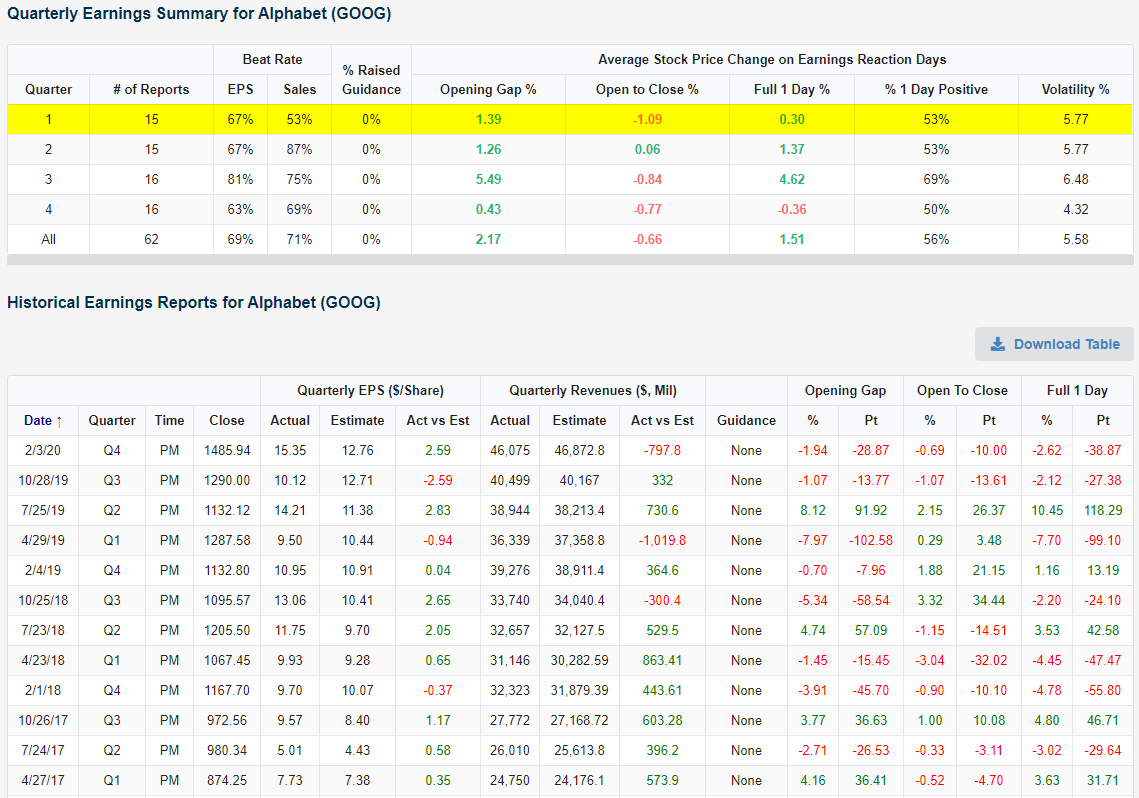
Below is a snapshot from our Earnings Explorer that shows how Alphabet’s (GOOG) share price has historically performed on its earnings reaction day. For GOOG’s Q1 earnings report specifically, the stock has historically averaged a small one-day gain of 0.30% in reaction to the news with positive returns just 53% of the time. Conversely, GOOG’s best earnings reports have come on its Q3 release where the stock has averaged a one-day gain of 4.62% in reaction to the news. For GOOG, the first quarter has also been the one that the company most often misses sales estimates.
As for Facebook (FB), which reports on Wednesday, historically the stock has beaten EPS estimates 94% of the time and sales estimates 90% of the time. In terms of share price reaction, FB has been a big winner on earnings with an average one-day gain of 2.7%. Looking at Q1 specifically, FB shares have averaged a gain of 3.38% on earnings reaction days with positive returns 57% of the time.

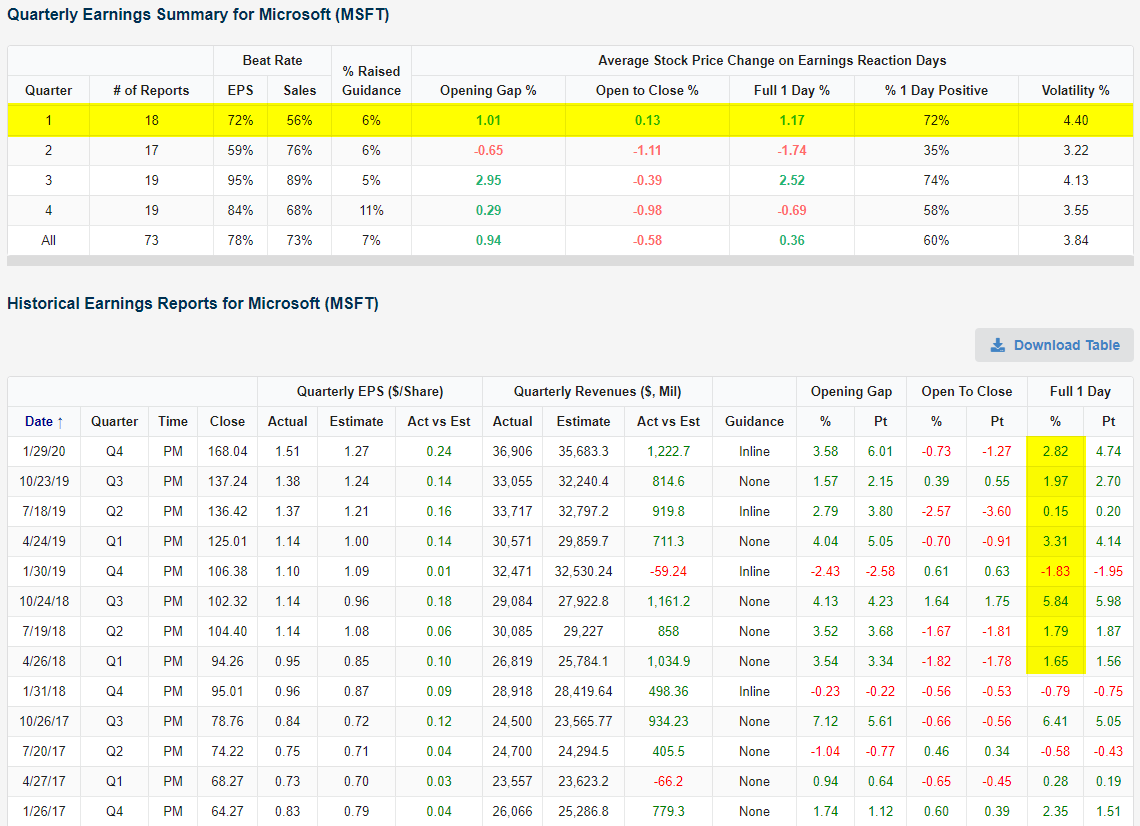
Microsoft (MSFT) heads into Q1 earnings as the largest stock (by market cap) in the S&P 500 and on a bit of a hot streak. As shown in the snapshot below, MSFT has seen gains on seven of its last eight earnings reaction days dating back to April 2018. On Q1 earnings days, MSFT has averaged a full day gain of 1.17% and has closed higher 72% of the time. Q3 is the only other quarter that has seen MSFT average gains on earnings reaction days. The worst quarter for MSFT earnings has historically been Q2 (reported in July). MSFT has averaged a decline of 1.74% on its Q2 earnings reaction days with positive returns only 35% of the time.
Amazon (AMZN) has been notable recently in that it managed to break out to fresh all time highs. With that strength at its back, AMZN heads into what is typically its strongest quarter in terms of share price reaction. Amazon has the highest sales and beat rates in the first quarter, and as a result, the strongest stock price reaction of any quarter. As shown below, AMZN has averaged a full day gain of 4.86% on Q1 earnings days compared to a 1.23% gain for all quarters. It has also been in the green around two-thirds of the time.

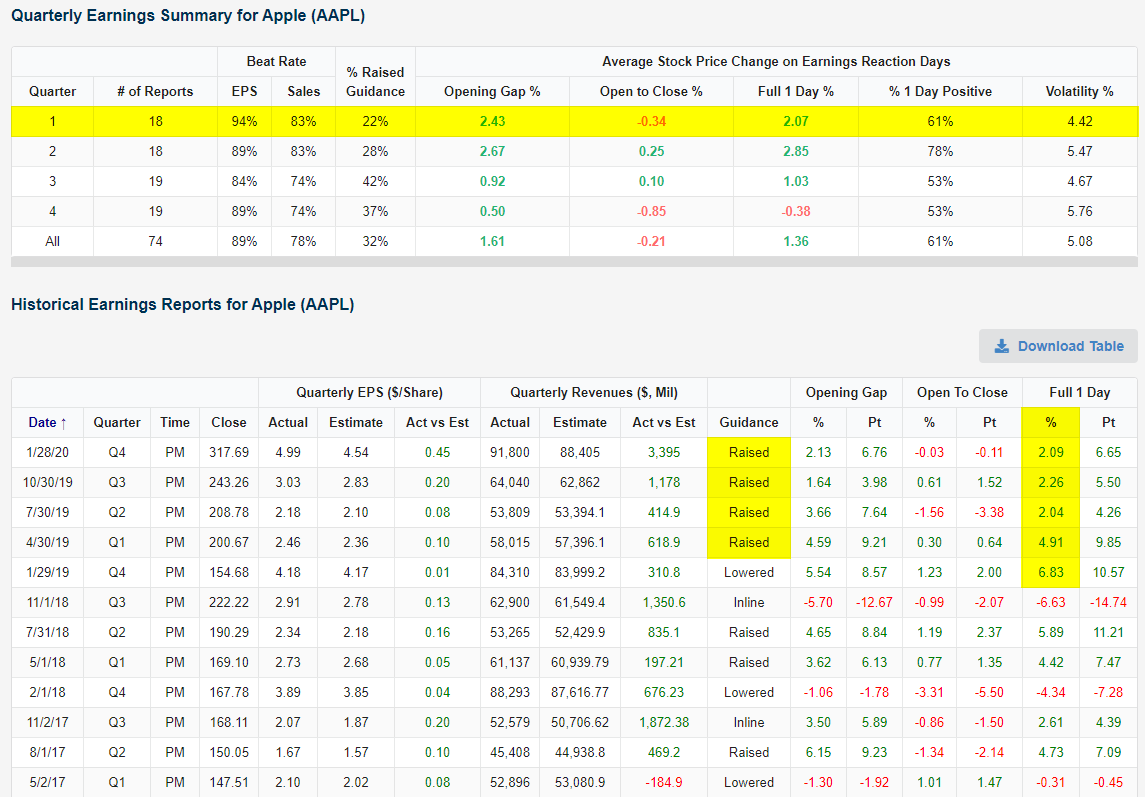
Like AMZN, Apple (AAPL) also heads into what has historically been one of its strongest quarters for earnings on a hot streak. The stock has risen on every earnings day of the past five quarters and Q1 earnings has been the second strongest for the stock with an average one-day gain of 2.07%. Additionally, every quarter of the past year has seen Apple report a triple play (EPS beat, sales beat, raised guidance). While nothing is out of the realm of possibilities, given the current environment’s impact on business, it is questionable if the company will keep up that streak of triple plays. For example, today it was reported that there will be delays in the new iPhone’s production. Regardless of whether or not the triple plays streak stays alive, AAPL has been seasonally strong in Q1, consistently beating EPS and sales estimates with the stock price reacting accordingly. Start a two-week free trial to Bespoke Institutional to access our interactive Earnings Explorer and much more.
Daily Sector Snapshot — 4/27/20
Chart of the Day – Years Like 2020
Another Regional Fed Record Low
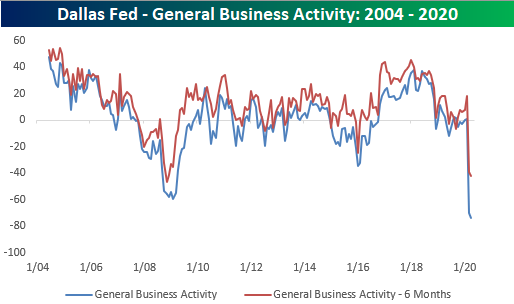
What an encore. Following the largest decline ever and a record low reading in the Dallas Fed’s Manufacturing index for March, April’s fared even worse as the headline index fell even further, dropping from -70 to -73. Although that is a new record low and far from a sign of good conditions in that region, it wasn’t as bad as the consensus reading of -75.
That thin silver lining aside, this month’s report was broadly weak. In addition to the headline number, the indices for current conditions on Production, Capacity Utilization, New Orders and New Order growth, and Shipments were all at their lowest levels ever (since 2004), and the six-month outlook indices for Company Outlook and Wages and Benefits were also both at record lows. As for the rest of the categories, if they were not at a record low they were close with most coming in at the 5th percentile or lower of all readings.
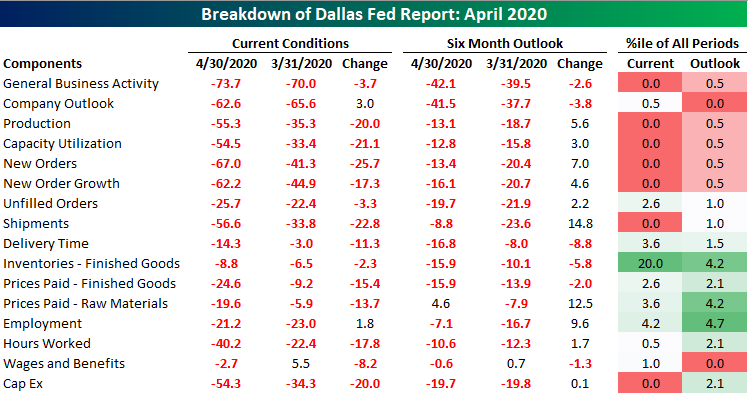
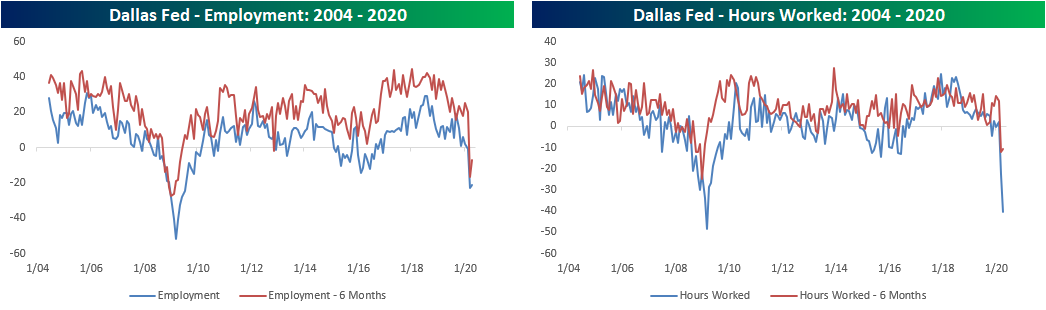
As we have frequently highlighted over the past month for other regional Fed indices, demand has been absolutely crushed. Each of the categories for demand like those for new and unfilled orders and shipments have completely collapsed. On the bright side, although they still remain low and the increases were small, there was a slight pickup in the outlook indices across these indicators in April.

The same can also be said for the categories covering employment. Outlook six months ahead for Employment and Hours Worked both picked up in April. Albeit, these are still around some of their lowest levels since the global financial crisis, and the index for current hours worked continued to fall in April as shutdowns remain in place. Start a two-week free trial to Bespoke Institutional to access our interactive economic indicators monitor and much more.