10-Day Advance/Decline Lines Running Hot
The gains in the first half of the week lifted every sector but two—Utilities and Financials—above their 50-DMAs. Meanwhile, Health Care had even touched overbought territory (over 1 standard deviation above its 50-day) earlier in the week, making it the first sector to be overbought since late February.
When it comes to another measure we monitor, the 10-day advance/decline line, conditions are more broadly appearing overbought. The 10-day advance/decline line measures the average number of daily advancers minus decliners in an index or sector over the last 10 trading days. Very high readings suggest that things have gotten extended in the very near term and downside mean reversion can be expected. Very low reading suggest the opposite.
The 10-day A/D lines for sectors have been pretty strong recently indicating broad participation in the rally, but this has led these readings to become elevated indicating conditions may be running a bit too hot in the near term. Outside of the defensive sectors like Consumer Staples, Utilities, and Real Estate, every sector’s 10-day A/D line has been in overbought territory at some point over the past week. The same can also be said for the 10-day A/D line for the S&P 500. We’d note, though, that while A/D lines are extended, they’re not at extreme levels seen at other points over the past year. Start a two-week free trial to Bespoke Institutional to access our Sector Snapshot report and much more.

Bespoke’s Morning Lineup – 5/1/20 – Not a Great Start
See what’s driving market performance around the world in today’s Morning Lineup. Bespoke’s Morning Lineup is the best way to start your trading day. Read it now by starting a two-week free trial to Bespoke Premium. CLICK HERE to learn more and start your free trial.
While most of Europe is closed for the Mayday holiday, US investors may wish that we were closed as well. Futures are indicating a down open as investors digest the big gains of April that followed the sharp declines of March. While the market’s reaction to earnings season has been positive to this point, the real test will come in the coming weeks as we begin to hear more from retailers and other companies that have been especially hit hard by the economic shutdown.
Be sure to check out today’s Morning Lineup for a rundown of the latest major earnings reports from the US, economic data out of Korea and the UK, and the latest trends in the COVID outbreak on a global, national, and state by state basis.

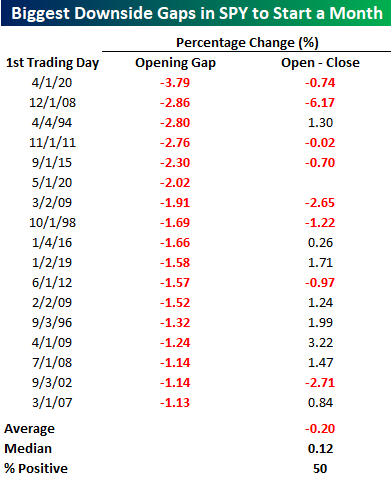
As mentioned above, the new month isn’t getting off to a positive start as the S&P 500 tracking ETF (SPY) is poised to open down around 2% to start the month. That doesn’t seem like an encouraging encore to April’s big gains. Since SPY first started trading in 1993, today would be only the 17th time that it has gapped down more than 1% to start off a new month, and if current levels hold it would only be the 6th downside gap of 2% or more.
Looking back at prior 1% downside gaps to start a month, the rest of the first day’s trading is a bit of a mixed bag with SPY averaging an open to close decline of 0.2% (median: +0.12%) with gains exactly half of the time. To find the most recent example of a 1% downside gap in SPY to start a month, you have to look no further back than last month when it gapped down 3.8% (worst ever downside gap to start a month), and then dropped an additional 0.74% from the open to close. While it was a bad first start to the month, the S&P 500 then went on to gain 18.01% from the close on 4/1 through month-end.
The Bespoke 50 Top Growth Stocks — 4/30/20
Every Thursday, Bespoke publishes its “Bespoke 50” list of top growth stocks in the Russell 3,000. Our “Bespoke 50” portfolio is made up of the 50 stocks that fit a proprietary growth screen that we created a number of years ago. Since inception in early 2012, the “Bespoke 50” has beaten the S&P 500 by 114.0 percentage points. Through today, the “Bespoke 50” is up 224.0% since inception versus the S&P 500’s gain of 110.1%. Always remember, though, that past performance is no guarantee of future returns. To view our “Bespoke 50” list of top growth stocks, please start a two-week free trial to either Bespoke Premium or Bespoke Institutional.

Bespoke’s Sector Snapshot — 4/30/20
Chart of the Day: 50/50 Pros & Cons
B.I.G. Tips – 10%+ Monthly Gains + May Seasonality
Over 30 Million Initial Jobless Claims Filed
Initial jobless claims fell this week for the fourth week in a row since the record high print of 6.867 million back in the final week of March. Claims came in at 3.839 million which was 588K less than last week but also above estimates of 3.5 million. That brings the total number of initial jobless claims filed over the past six weeks (when there was the first print over 1 million) to over 30 million which is over 9% of the entire US population.

On a non-seasonally adjusted basis, this week was only the third consecutive decline off of the peak of 6.211 million which came one week later than the seasonally adjusted data’s peak. This week’s decline brought jobless claims down to 3.489 million.

Since the huge spike in jobless claims began in late March, the 4-week moving average has risen every single week, except for today. This week, the four week average fell 753.25K down to 5.033 million. As with the other readings, while that is still lower, the moving average remains extremely high compared to the rest of history. Start a two-week free trial to Bespoke Institutional to access our interactive economic indicators monitor and much more.

B.I.G. Tips – May Intraday Seasonality
Bulls Crawling Back
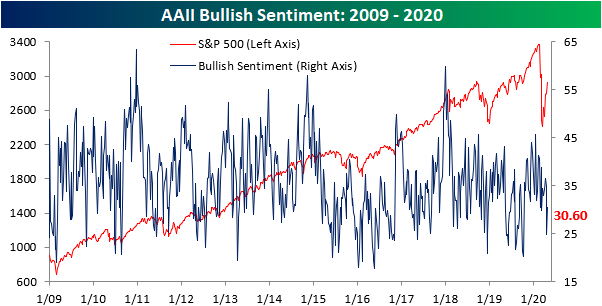
The volatile swings in crude oil last week sent investor sentiment sharply lower with only 24.86% of investors reporting as bullish which was the lowest level of bullish sentiment since the COVID-19 outbreak began.. With things calming down in the days since and with equities continuing to grind higher, sentiment has improved as the percentage of investors reporting as bullish rose to 30.6%. While an improvement, that is still less than where bullish sentiment has been over the past several weeks. Since the sell-off began on 2/19, bullish sentiment has averaged 33.44%, around 3 percentage points above current levels.
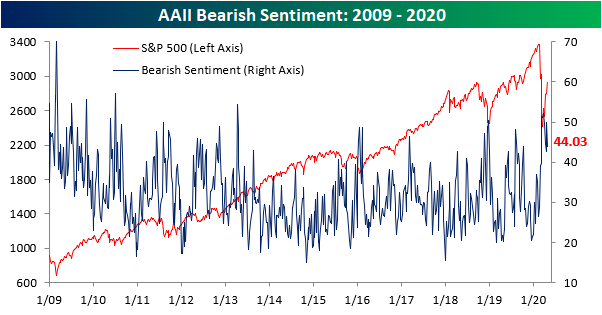
Last week, we noted a strong bearish bias in which the percentage of bearish investors doubled those reporting as bullish. That has subsided this week as bearish sentiment pulled back from 50% to 44.03%. With less than half of investors now negative, bearish sentiment is within one percentage point of its average since the 2/19 peak, 44.83%.
Most of the gains and losses to bulls and bears took from each other as neutral sentiment went little changed. 25.37% of investors reported as neutral which was only 0.23 percentage points more than last week’s reading of 25.14% Start a two-week free trial to Bespoke Institutional to access our interactive economic indicators monitor and much more.
