Bespoke Stock Scores — 8/11/20
B.I.G. Tips – New Highs In Sight
Whether you want to look at it from the perspective of closing prices or intraday levels, the S&P 500 is doing what just about everybody thought would be impossible less than five months ago – approaching record highs. Relative to its closing high of 3,386.15, the S&P 500 is just 0.27% lower, while it’s within half of a percent from its record intraday high of 3,393.52. Through today, the S&P 500 has gone 120 trading days without a record high, and as shown in the chart below, the current streak is barely even visible when viewed in the perspective of all streaks since 1928. Even if we zoom in on just the last five years, the current streak of 120 trading days only ranks as the fourth-longest streak without a new high.
While the S&P 500’s 120-trading day streak without a new high isn’t extreme by historical standards, the turnaround off the lows has been extraordinary. In the S&P 500’s history, there have been ten prior declines of at least 20% from a record closing high. Of those ten prior periods, the shortest gap between the original record high and the next one was 309 trading days, and the shortest gap between highs that had a pullback of at least 30% was 484 tradings days (or more than four times the current gap of 120 trading days). For all ten streaks without a record high, the median drought was 680 trading days.

Whenever the S&P 500 does take out its 2/19 high, the question is whether the new high represents a breakout where the S&P 500 keeps rallying into evergreen territory, or does it run out of gas after finally reaching a new milestone? To shed some light on this question, we looked at the S&P 500’s performance following each prior streak of similar duration without a new high. To read the report, start a two-week free trial to Bespoke Premium today.
Small Business Split
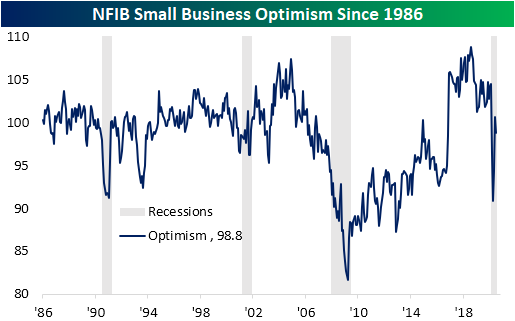
After two months of some of the largest gains to small business confidence on record, NFIB’s Small Business Optimism index pulled back slightly in July. The index fell 1.8 points to 98.8 which was also below expectations of a reading of 100.5. While lower sequentially and still well off the highs from prior to the pandemic, July’s level of 98.8 was less than half a point from the historic average for small business optimism of 98.4.
Overall, breadth was very mixed in the July report. Of the ten components of the headline index, four fell, one was unchanged and the other five rose. As the pandemic drags on, the most glaring decline weighing on the headline number was for expectations of improvements in the economy. Fewer companies reported now as a good time to expand (that index fell to 11 from 13 in June) and a net percentage of 25% expect the economy to improve compared to 39% in June. The 14 point decline is tied with an identical decline in August of 2011 for the seventh-largest MoM decline on record for that index, but it only leaves that component in the 81st percentile of all readings. In other words, small businesses are less optimistic for the future than they were in June, but on net are still expecting the economy to improve. That can be seen through hiring plans as a higher share plan to increase employment and increase capital expenditures with those indices rising 2 points and 4 points, respectively. On the other hand, fewer businesses plan to increase inventories as those expecting higher sales remains muted albeit improving. That can also be seen through the 3 point rise in the index for actual earnings changes. Fewer businesses were also reporting weak sales as the most pressing issue for business.
Additionally, although they are not inputs to the headline index, a record low of 26 percent reported borrowing on a regular basis, though, the cause of that does not appear to be due to credit availability. The index for credit availability was slightly higher in July and remains in the top 5% of all readings. The most important issues echo this as only 1% reported financials and interest rates to be the biggest issue; unchanged from last month. The biggest issue for businesses remains the quality of labor. That index rose from 19 in June to 21 in July. Click here to view Bespoke’s premium membership options for our best research available.

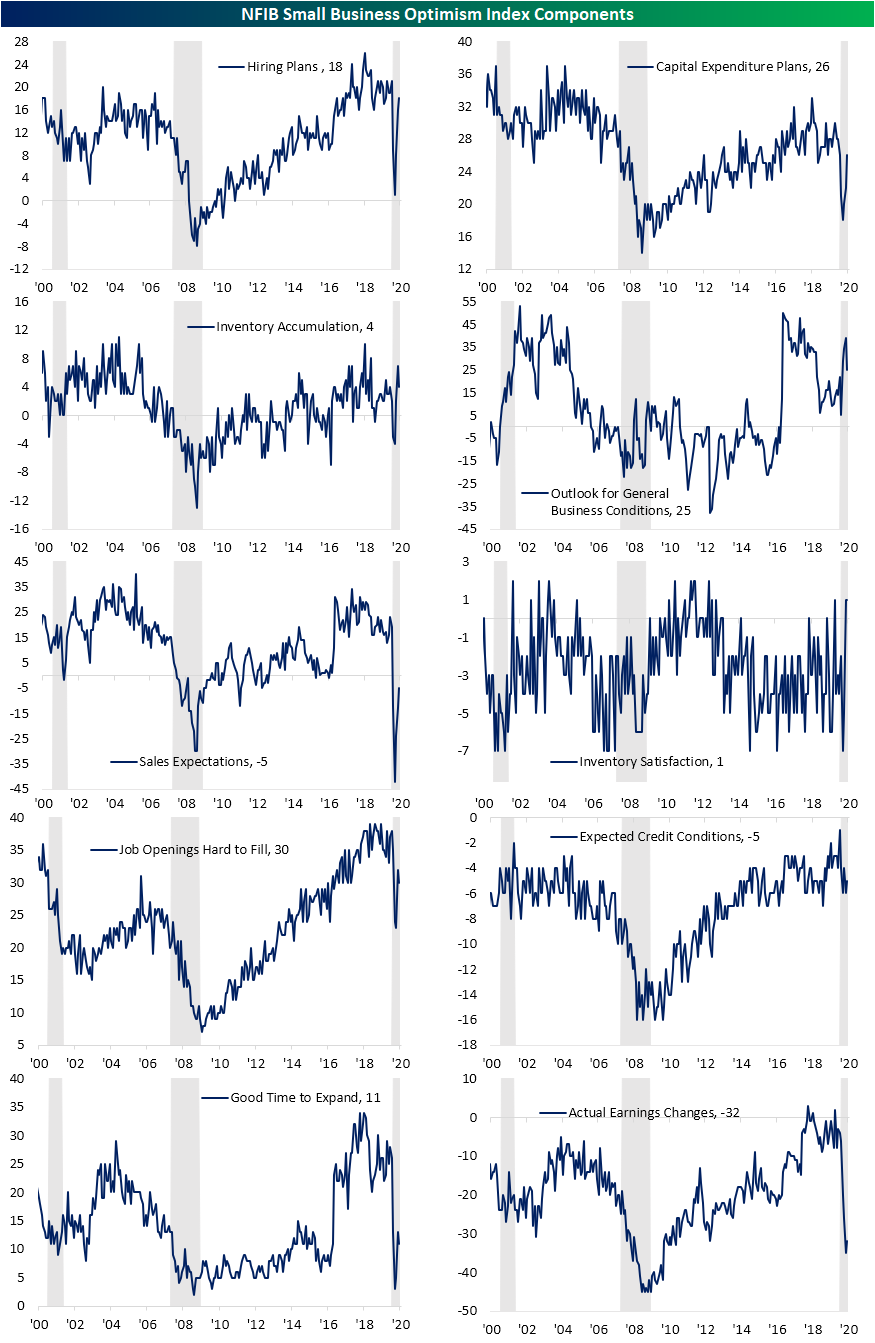
Chart of the Day: Gold (GLD) Gaps Down
Bespoke’s Morning Lineup – 8/11/20 – New Highs Back in View
See what’s driving market performance around the world in today’s Morning Lineup. Bespoke’s Morning Lineup is the best way to start your trading day. Read it now by starting a two-week free trial to Bespoke Premium. CLICK HERE to learn more and start your free trial.
Can we make it eight in a row? Based on this morning’s move in the futures, the DJIA and S&P 500 are both on pace to extend their current seven-day winning streaks to eight. The Nasdaq, meanwhile, is working on its own streak as it is on pace to underperform the S&P 500 for the third straight day.
In economic news, the NFIB Small Business Optimism report missed expectations, and PPI came in much higher than expected. That hotter than expected inflation data hasn’t had any impact on futures as of yet, though.
Be sure to check out today’s Morning Lineup for a rundown of the latest stock-specific news of note, market performance in the US and Europe, trends related to the COVID-19 outbreak, and much more.

As the S&P 500 sets its sights on new record highs, its cumulative A/D line has already set the path. With a number of positive readings in the last few days, the cumulative A/D line has broken out of its short consolidation range from the last couple of weeks. That’s an encouraging sign for the direction of the market going forward, even as tech starts to take a back seat.

Daily Sector Snapshot — 8/10/20
Chart of the Day: Record Guidance and Strong Beat Rates
A Rare Case of the Mondays for the Nasdaq
For most of us, Monday is the worst day of the week, but for the Nasdaq lately, it doesn’t get any better than Monday. The chart below shows the Nasdaq’s performance on Mondays since the closing low for the S&P 500 on 3/23. On that day, the Nasdaq fell a pedestrian 0.3%. Since then, Mondays have been a blockbuster. In the 19 weeks between 3/23 and today, the Nasdaq’s average gain on Mondays (or Tuesday if Monday was a holiday) has been +1.4% with only two declines. Not only that, but on 13 of those Mondays, the Nasdaq has been up over 1%, including eight of the last nine heading into this week. On a cumulative basis, half of the Nasdaq’s entire gain off of the March 23rd lows was from Mondays alone. With the Nasdaq down half of a percent so far today, the magnitude of the decline isn’t all that notable but relative to other Mondays recently, it stands out like a sore thumb. Click here to view Bespoke’s premium membership options for our best research available.

Rocket Reversals
Over the last few days, we’ve been seeing a moderate rotation in the market as red-hot growth stocks sell-off and investors shift into other areas of the market that have been lagging. To highlight this, the table below highlights 24 companies in the Russell 3,000 with market caps of more than $1 billion that traded at a 52-week high within the last month but are currently down more than 20% from that high. The vast majority of these stocks are names that investors haven’t been able to get enough of in 2020 but now appear to have had their fill.
Topping the list of these reversals is Eastman Kodak (KODK). On 7/29, the stock surged to a 52-week high of $60.00 after being awarded a questionable government contract to domestically produce components for prescription drugs. With the SEC and government agency that originally awarded the contract now looking into stock option awards at the company just before it was announced, the stock has pulled back sharply and is now down over 80% from its high less than two weeks ago.
While KODK is more of a unique example, other names on the list are primarily growth or health care stocks that have benefited from the COVID outbreak. However, now that signs suggest the summer wave in the south has crested, investors appear to be taking some profits. Shares of Vaxart (VXRT) hit a high of $17.49 on July 14th but have since lost nearly half of their value and trade back in the single-digits. Additionally, Bloom Energy (BE), 1Life Healthcare (ONEM), and Bioxcel Therapeutics (BTAI) have all lost more than a third of their value.
In terms of market cap, most of the names listed are on the small side, but Tesla (TSLA) is a notable exception as it is now just over 20% below its 52-week high on 7/13. Other relatively large companies on the list include Moderna (MRNA), Citrix Systems (CTXS), Teladoc (TDOC), and Livongo (LVGO). TDOC and LVGO both hit all-time highs last week but after announcing a mostly stock merger last Wednesday, both have lost nearly a quarter of their value.
While all of the stocks listed below have seen sharp pullbacks in the last several days, a little perspective is in order. Of the 24 names listed, the average YTD change even after the declines has been a gain of 219.7% (median: +94.6%). Only two of the stocks shown (New Relic- NEWR and Sonos- SONO) are down YTD, and half of them have at least doubled and in many cases much more. Click here to view Bespoke’s premium membership options for our best research available.

Bespoke’s Morning Lineup – 8/10/20 – Apple vs Russell
See what’s driving market performance around the world in today’s Morning Lineup. Bespoke’s Morning Lineup is the best way to start your trading day. Read it now by starting a two-week free trial to Bespoke Premium. CLICK HERE to learn more and start your free trial.
“There is a huge difference between a good trade and good trading.” – Steve Burns
The week looks to be kicking off on a quiet note, but what else would you expect? It’s August. S&P 500 futures are modestly higher, and Nasdaq futures are modestly lower. That may not sound like anything particularly significant, but keep in mind that the Nasdaq has been up 1%+ on eight of the last nine Mondays and positive on 13 of the last 14, so down Mondays have been pretty uncommon lately.
Be sure to check out today’s Morning Lineup for a rundown of the latest stock-specific news of note, economic news in Europe and the US, trends related to the COVID-19 outbreak, and much more.
Apple’s (AAPL) extraordinary run in this year has the stock closer to achieving what would surely be a monumental feat. The chart below shows the historical market cap of AAPL against the Russell 2000. For most of 2019, the market cap spread between the two was over a trillion dollars. But then COVID hit. As AAPL’s stock was much less impacted than the companies in the Russell 2000, the market cap spread between the two has narrowed substantially this year, and on Thursday reached a record low of just under $250 billion. On Friday, the spread narrowed out again to just under $340 billion. Even at that level, though, it’s pretty amazing that there’s such a narrow spread between the market cap of one company and an entire index- even if that index is comprised of small-cap companies.
