Daily Sector Snapshot — 7/7/20
High Stock Scores Nearing Break Outs
Each Tuesday we publish an update of our Bespoke Stock Scores which ranks the constituents of the S&P 1500 based on our proprietary fundamental, technical, and sentiment indicators. This week, several of the top-scoring stocks are eyeing breakouts to new 52-week highs which we show in the charts below. Semiconductor manufacturer Axcelis (ACLS) took the number one spot in this week’s Stock Scores as it stopped just short of a breakout above its February highs yesterday. Although it reversed at that resistance, it remains above its moving averages and is in an uptrend over the past few months. It is a similar story for other stocks like Regal Beloit Corp (RBC), Molina Healthcare (MOH), Kroger (KR), and Domino’s (DPZ) which have also been sitting right around resistance at the past few months’ highs. KR, MOH, and RBC have even seen small breakouts that did not hold. Meanwhile, another name with a high Bespoke Stock Score – Conagra (CAG) – broke out slightly to new highs in the past week before a small pullback with former resistance acting as support. Today, CAG is headed higher off of its previous highs. Click here to view Bespoke’s premium membership options to gain access to our Stock Scores report.
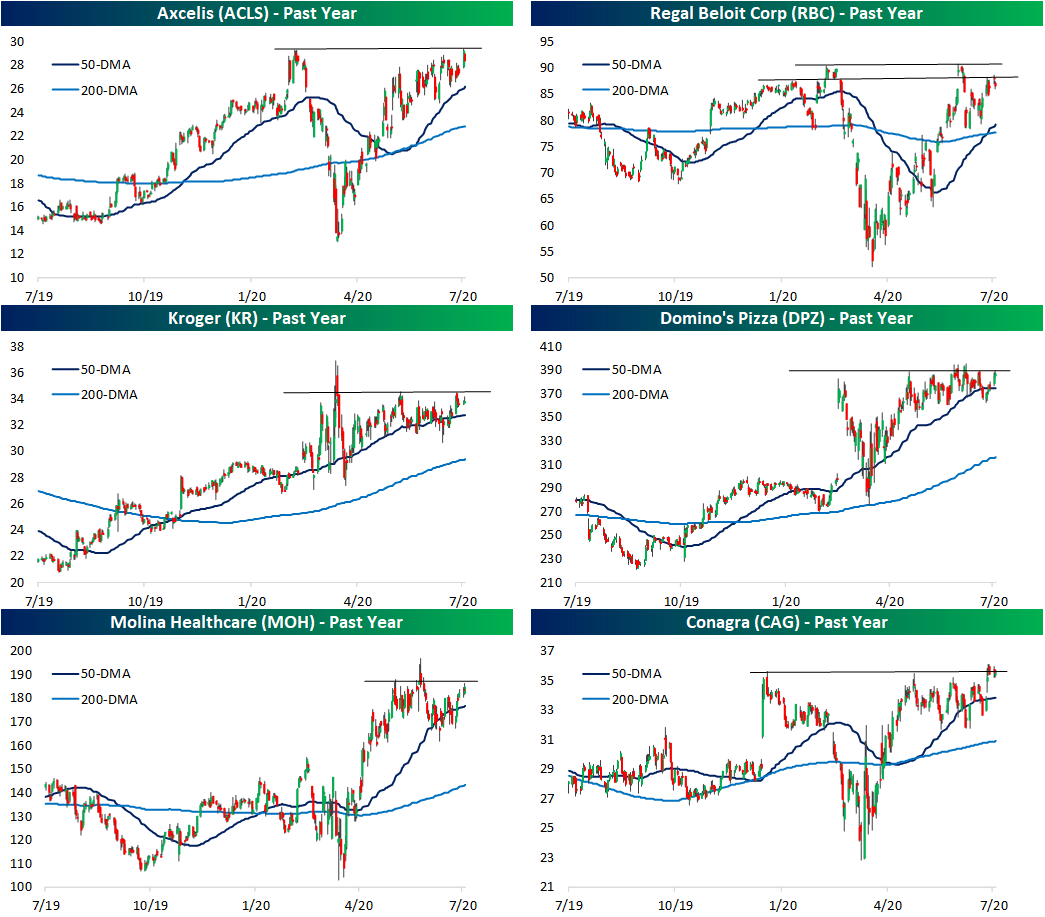
Chart of the Day: Five Day Winning Streak on the Ropes
Bespoke Stock Scores — 7/7/20
June 2020 Headlines
Bespoke’s Morning Lineup – 7/7/20 – Rally Rests
See what’s driving market performance around the world in today’s Morning Lineup. Bespoke’s Morning Lineup is the best way to start your trading day. Read it now by starting a two-week free trial to Bespoke Premium. CLICK HERE to learn more and start your free trial.
You wouldn’t think that on a lucky day like 7/7 that the equity market would break a streak of five straight days with gains of 0.5% in the S&P 500 tracking ETF SPY, but that’s where we stand ahead of the opening bell today. Futures are slightly off their earlier lows but still indicating a decline of just 0.60% at the open. Besides the fact that the S&P 500 has been up for five straight days and could use a rest, there isn’t much in the way of a key catalyst responsible for the decline, although Industrial Production in Germany did come in significantly weaker than expected. While Europe has seemed to see better trends related to squashing the COVID outbreak, economic data hasn’t yet shown material outperformance.
Be sure to check out today’s Morning Lineup for a rundown of the latest stock-specific news of note, weaker than expected economic data out of Europe, global and national trends related to the COVID-19 outbreak, and much more.

We normally don’t show the same chart two days in a row, but yesterday saw a positive shift in the S&P 500’s cumulative A/D line. While breadth had been tracking price step for step, in yesterday’s rally the cumulative A/D line made a higher high in the short term even as the S&P 500 has yet to break above its June highs. That’s a positive short-term development.

Daily Sector Snapshot — 7/6/20
Three Cross $1.5 Trillion
Earlier today we noted on our Twitter feed that “the combined market cap of Apple and Microsoft is now 54% greater than the ENTIRE Russell 2000.” Adding to that stat, below is a look at the 40 largest stocks in the S&P 500 as of mid-day (7/6/20). Notably, four stocks are now worth more than $1 trillion in market cap, and three of them are actually more than $1.5 trillion in market cap. Apple (AAPL) leads the way at $1.62 trillion, followed by Microsoft (MSFT) at $1.59 trillion and Amazon.com (AMZN) at $1.5 trillion. Alphabet (GOOGL) rounds out the list of four “trillion dollar stocks” with a market cap of only $1.02 trillion.
The four largest S&P 500 companies have a combined market cap of more than $5.7 trillion. That’s roughly the same amount as the combined market cap of the remaining 20 companies with market caps above $200 billion. Along with Netflix (NFLX), three other stocks that continue to move up the list are NVIDIA (NVDA), Adobe (ADBE), and PayPal (PYPL). NVDA is now right on the heels of Intel (INTC) as the largest semiconductor company in the US. As of today, NVDA is less than $9 billion away from Intel’s $250 billion market cap. PayPal (PYPL) — which owns Venmo — is now the 21st largest stock in the S&P 500, which puts it ahead of blue chips like Disney (DIS), Bank of America (BAC), Cisco (CSCO), Coca-Cola (KO), and Exxon Mobil (XOM). Click here to view Bespoke’s premium membership options for our best research available.

Best and Worst Performing Stocks Year-to-Date
The average stock in the Russell 1,000 is down 4.66% in 2020. Roughly two-thirds of the index is still in the red for the year, while one-third of index members are in the green. Below is a list of the best performing stocks in the index as of mid-day (on 7/6/20). Fastly (FSLY) is up the most with a YTD gain of 303% followed by Zoom Video (ZM) at +284.7% and Livongo Health (LVGO) at +221.4%. Tesla (TSLA) ranks 4th with a gain of 210%, while Quidel (QDEL) rounds out the top five with a gain of 207%. Other notables on the list of 2020’s biggest winners include DocuSign (DOCU), Teladoc (TDOC), Etsy (ETSY), Wayfair (W), Square (SQ), Beyond Meat (BYND), Peloton (PTON), and Spotify (SPOT). This is a who’s who of companies that have managed to thrive through global COVID-19 concerns.

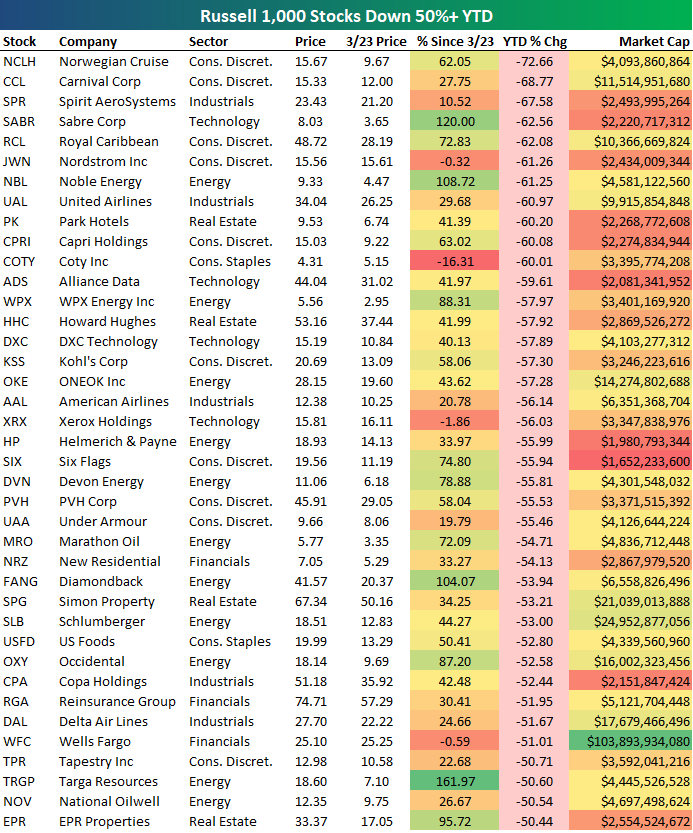
There are 39 stocks in the Russell 1,000 that are still down 50% or more year-to-date. The list of 2020’s biggest losers is led by two cruise lines — Norwegian (NCLH) and Carnival (CCL). Whereas the list of the year’s biggest winners is led by stocks that thrive in an environment that doesn’t require physical movement, travel, and/or leisure, the list of 2020’s biggest losers is littered with stocks most impacted by a halt of the “movement” economy. Other notables on the list of stocks down 50%+ year to date include Royal Caribbean (RCL), Nordstrom (JWN), United Airlines (UAL), Kohl’s (KSS), American Airlines (AAL), Six Flags (SIX), and Delta (DAL). Wells Fargo (WFC) is one of the few Financial stocks on the list with a YTD decline of 51%. Click here to view Bespoke’s premium membership options for our best research available.
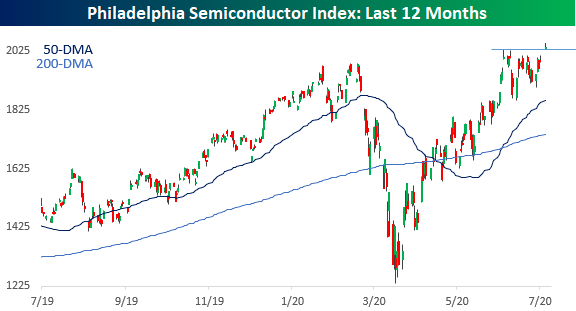
Another New High For Semis
One month and a day since the Philadelphia Semiconductor Index (SOX) last made an all-time, the index did it again today right at the opening bell clearing both short-term resistance and breaking a small string of lower highs that has been in place since that 6/5 high.
Semis started the month on a negative note last Wednesday, underperforming the S&P 500 by over a percentage point. In the last two trading days, though, the index has turned things around and is only marginally underperforming the S&P 500 MTD. While the index may be underperforming, the vast majority of the index’s 30 components are still in positive territory with just five stocks in the index in the red on a MTD basis. Leading the way to the downside, Micron (MU), ON Semiconductor (ON), and Intel (INTC) are the only three stocks down more than 1%. To the upside, Taiwan Semi (TSM), ASML, and Teradyne (TER) are all up over 4%.
Even with the index’s recent underperformance, since both the February market highs and the March lows, semis are trouncing the broader market. While the S&P 500 is down 6.41% since its peak on 2/19, the SOX is up close to 3% while Marvell (MRVL), Teradyne (TER), Monolithic Power (MPWR), CREE, NVIDIA (NVDA), and ASML are all up over 20%. Not surprisingly, returns since the March lows have been jaw-dropping. While no stocks in the SOX have seen triple-digit percentage gains, four stocks are up by more than 80%, no stocks are down, and the ‘average’ stock in the index is up over 51%.
For a group to be considered such a good leading indicator for the broader economy, the fact that semis continue to outperform the broader market is a positive trend. Like what you see? Click here to view Bespoke’s premium membership options for our best research available.
