Bespoke’s Morning Lineup – 11/8/19 – Curve Ball
See what’s driving market performance around the world in today’s Morning Lineup. Bespoke’s Morning Lineup is the best way to start your trading day. Read it now by starting a two-week free trial to Bespoke Premium. CLICK HERE to learn more and start your free trial.
The Closer – What To Buy When Yields Fly; What To Sell When Curves Fall – 11/7/19
Log-in here if you’re a member with access to the Closer.
Looking for deeper insight on markets? In tonight’s Closer sent to Bespoke Institutional clients, as risk sentiment has improved, yields have soared. We begin with a look at some of the stocks with the highest and lowest correlations to the 10-year yield. Given this we also show the deteriorating technical picture of Treasury futures. On the bright side, we then review some more bullish charts of international equities including CWI, EEM, and ASHR. We finish tonight with an update to Bloomberg’s weekly data on Consumer Comfort which has dropped substantially in the past two weeks.

See today’s post-market Closer and everything else Bespoke publishes by starting a 14-day free trial to Bespoke Institutional today!
S&P 500 Price vs 50-DMA
The S&P 500 has been on a seemingly uninterrupted run higher over the last several days, but by some measures, it may not be as extended as you would think. The chart below shows the historical percentage spread between the S&P 500 and its 50-day moving average (DMA) over the last three years. Through Thursday’s close, the S&P 500 was 3.2% above its 50-DMA, which is relatively high but nowhere near an extreme. The red line in the chart below shows the current percentage spread between the S&P 500’s price and its 50-DMA. There have been a number of times since the 2016 election where this spread was higher with the most recent being back in July. In fact, 17% of all prior days in the last three years have seen the S&P 500 close at a higher level relative to its 50-DMA than it is now. That doesn’t mean the market isn’t overbought, but it’s not exactly at unprecedented levels either. Sign up for Bespoke’s “2020” special and get our upcoming Bespoke Report 2020 Market Outlook and Investor Toolkit.
Bespoke’s Sector Snapshot — 11/7/19
Bespoke S&P 500 Sector Weightings Report — November 2019
S&P 500 sector weightings are important to monitor. Over the years when weightings have gotten extremely lopsided for one or two sectors, it hasn’t ended well. Below is a table showing S&P 500 sector weightings from the mid-1990s through 2016. In the early 1990s before the Dot Com bubble, the US economy was much more evenly weighted between manufacturing sectors and service sectors. Sector weightings were bunched together between 6% and 14% across the board. In 1990, Tech was tied for the smallest sector of the market at 6.3%, while Industrials was the largest at 14.7%. The spread between the largest and smallest sectors back then was just over 8 percentage points.
The Dot Com bubble completely blew up the balanced economy, and looking back you can clearly see how lopsided things had become. Once the Tech bubble burst, it was the Financial sector that began its charge towards dominance. The Financial sector’s sole purpose is to service the economy, so in our view you never want to see the Financial sector make up the largest portion of the economy. That was the case from 2002 to 2007, though, and we all know how that ended.
Unfortunately we’ve begun to see sector weightings get extremely out of whack once again.
If you would like to see the most up-to-date numbers for S&P 500 sector weightings, simply start a two-week free trial to our Bespoke Premium or Bespoke Institutional services. Click back to this post to see the numbers once you’re signed up!
Sentiment Sharply Rebounds
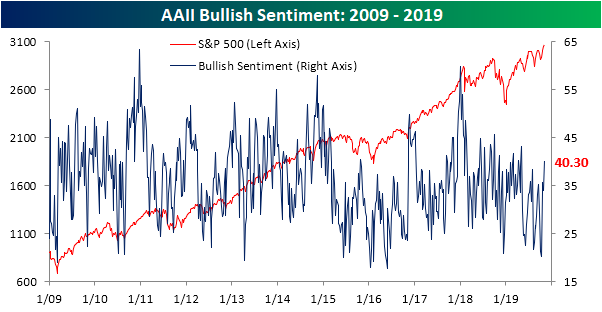
Fresh all-time highs in the major indices have finally boosted investor confidence as per AAII data. Rising to 40.3% from 33.98% last week, the percentage of bullish investors rose to the highest level since early May when it was 43.13%. The past four weeks have seen bullish sentiment surge by just under 20 percentage points off of the low of 20.31% in early October. The last time that optimism has risen as rapidly in a four week span was from December of 2017 to January of 2018 when it rose 22.9 percentage points. At that time, sentiment reached much more extreme levels, topping out at 59.75%.
Bullish sentiment has also moved back above its historical average of 38.08% for the first time since August 1st. For most of this year, bullish sentiment has remained fairly subdued. With only a couple of months left in the year, only 9 weeks in 2019 have seen bullish sentiment readings above the historical average. In the history of the survey, only 2016, 1988, and 1987 saw fewer weeks with above average bullish readings.
Given the bullish surge, bearishness has unwinded. After reaching its recent high of 44% last month, bearish sentiment has fallen all the way down to 23.93%. That is the lowest reading since May. As with bullish sentiment, the move over the past four weeks has been substantial. In fact, the 20.03 percentage point decline is the largest since March of 2016 when bearishness dropped 24.32 percentage points.
Bulls not only took from bears this week, but neutral sentiment also fell down to 35.77%. Unlike bullish and bearish sentiment, that move was much smaller at only 1.82 percentage points as neutral sentiment is now right back to similar levels as last month. Start a two-week free trial to Bespoke Institutional to access our interactive economic indicators monitor and much more.
Chart of the Day: Transports Roll To New Highs
Claims Remain Rangebound
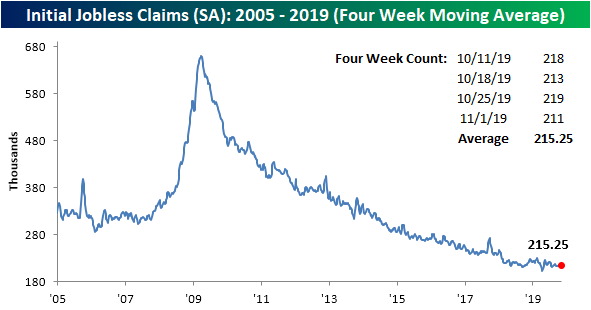
Initial jobless claims improved this week, falling to 211K from an upwardly revised 219K last week. This 8K decline was larger than expected as forecasts were calling for claims to fall to 215K. Jobless claims remain in the range of the past few months and are also the lowest since the 210K print in the first week of October. With this week’s print, claims have now held at or below 300K and 250K for record streaks of 244 and 109 consecutive weeks, respectively.
The four-week moving average, which helps to smooth out the line by removing some of the week to week fluctuations, rose this week to 215.25K.
While still strong, claims have not done much recently as they have simply meandered sideways. In the past month alone, the four-week moving average has been in a range between 215K and 216K. As shown in the chart below, the 4-week moving average has been extremely rangebound over the past 3 months. With just 4.25K between the past 12 week’s highest and lowest readings, the moving average has been in the tightest range since August of 2017 when that range was 4K. Going back before that, times that the 12-week range falls below 5K have been few and far between. The only other time in the history of the data with a range of 5K or tighter was in July of 1973. At that time, claims stood around 230K and 240K. Those past occurrences did not see these tight ranges stay in place for extended periods of time as the range typically began to widen afterward. In regards to recessions (gray shaded regions on the chart), while they often follow a sharp widening that was preceded by a tight range, tight ranges by themselves are not necessarily an early warning sign. While the 1973 period was followed by a recession, just two years ago we saw a similarly narrow range with no recession. There have also been many other periods where the spread narrowed to similarly tight levels right in the middle of economic expansions.
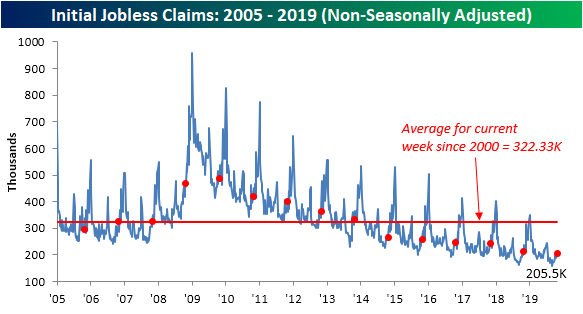
As is the norm for this time of year, non-seasonally adjusted claims have continued to rise this week. Now up to 205.5K from 198.7K last week, NSA claims are at their highest level since July. While seasonally adjusted claims have been rangebound, the NSA data did fall year-over-year. One year ago, NSA claims stood at 214.8K. Start a two-week free trial to Bespoke Institutional to access our interactive economic indicators monitor and much more.
New Highs for the Transports of Today and Yesteryear
The S&P 500 is trading at another new all-time high today and one development that has a lot of technicians excited is that the Dow Transports is also poised to close at a new all-time high as well. For many market watchers, the new high in the Transports helps to serve as confirmation of the rally in the overall market. For these investors, the emphasis on the Transports stems from the fact that companies in this index were always involved in moving goods from point A to point B, and therefore, these stocks would be the first to reflect strength or weakness in the broader economy. With the Transports on pace to close at an all-time high for the first time in over a year today, the strength helps to serve as confirmation of the broader market rally.
While transportation stocks are still heavily involved in the moving of goods across and into and out of the United States, the US economy of the 21st century is not the same economy of the 20th century. Economic activity today is much more service and digitally-oriented than manufactured and goods oriented. Because of the shift, the importance of the transports as a leading indicator of the economy has lost some of its relevance. We have contended for some time that the ‘transports’ of today’s 21st-century economy are the semiconductors as they are embedded in just about every aspect of our lives from computers to cellphones and even toilets!.
Whether you look to the semis or the transports as a market leader, today it doesn’t really matter. That’s because just as the Dow Transports hit a new high this morning, so too did the Philadelphia Semiconductor Index (SOX). Today’s rally for the SOX only made a marginal new high, but with the index at all-time highs and sitting on a 51% YTD gain, they don’t seem to be anticipating anything much in the way of a slowdown. Sign up for Bespoke’s “2020” special and get our upcoming Bespoke Report 2020 Market Outlook and Investor Toolkit.
Bespoke’s Morning Lineup – 11/7/19 – Use the Positive Trade Headline Today
See what’s driving market performance around the world in today’s Morning Lineup. Bespoke’s Morning Lineup is the best way to start your trading day. Read it now by starting a two-week free trial to Bespoke Premium. CLICK HERE to learn more and start your free trial.


