Richmond on the Rise
The final regional Fed manufacturing index of the month came out today from the Richmond Fed. The headline index continued to improve rising 10 points in July indicating the first expansion in the region since March and the highest reading for the index since January.

Along with the headline index, just about every sub-index posted expansionary readings. Shipments, Capacity Utilization, and Availability of Skills are in the upper decile of historical readings. When it comes to the indices for future expectations. even more categories are around some of their highest readings on record. For example, the indices for future conditions for Shipments, New Orders, Order Backlogs, Capacity Utilization, Vendor Lead Times, Local Business Conditions, and Number of Employees are all in the 90th percentile or better.
The only areas that remain on the weak side for both present and future conditions are for expenditures. For current conditions, Capital Expenditures, Equipment & Software Expenditures, and Services Expenditure are all at the low end of historical readings with little improvement in July. Additionally, a greater share of companies continue to report decreases than increases in their workforce as the index for the Number of Employees remained below zero for a fifth consecutive month. Altogether, this points to a generally improved backdrop for mid-Atlantic manufacturing businesses, though they remain hesitant to invest back into and expand their businesses.


Even though the manufacturing sector has staged a massive turnaround, the same cannot be said for the services sector. Service sector businesses did report Local Business Conditions improved in July, but Demand, Revenues, Expenditures, and employment all remain in contraction. Expectations are more optimistic, but there were some large declines this month, namely in the expectations indices for Revenues, Demands, and Local Business Conditions. Click here to view Bespoke’s premium membership options for our best research available.


Chart of the Day: Early Earnings Results Strong
Recreational Vehicles, Outdoors, and More
Throughout the pandemic, we have frequently highlighted how Google searches for things like boats, camping, gardening, and many other outdoor activities have been sharply on the rise. Consumer shifts towards outdoor recreational activities from sea to shore have been the benefit of many names. Below we show just over two dozen stocks that are in some form related to things like recreational vehicles, camping, sporting goods retailing, boating, golf, gardening, and the likes. As shown, while they had fallen by nearly 50% during the bear market, off the lows they have surged. 21 of these names have risen by at least 100% and their average gain since 3/23 is more than 200%. We find it fascinating how much these stocks got “thrown out with the bathwater” in the initial stages of the pandemic. With an average decline of 48% during the 2/19-3/23 bear market, investors certainly were not thinking about a big shift towards socially-distanced outdoor activities at the time.
Given the runs they’ve had, they’re generally very elevated. On average, these stocks are 23.81% above their 50-DMAs and 52.9% above their 200-DMAs. Granted, there is a sizeable range in regards to distance from the moving averages. For example, Winnebago (WGO) is less than 1% from its 50-DMA while Big 5 Sporting Goods (BGFV) is over 90% above its 50-DMA. The same goes for the 200-DMA Camping World (CWH), which we highlighted in a post yesterday, is almost 150% above its 200-DMA while Columbia Sportswear (COLM) is actually under its 200-DMA; the only of these stocks that this applies to.
Given the elevated price levels and massive runs, short interest has built up for several of these names. Hibbett Sports (HIBB) is the worst of these with 34.57% of float sort. Camping World (CWH), OneWater Marine (ONEW), and Dick’s Sporting Goods (DKS) also all have readings above 20%. By comparison, the average stock in the S&P 1500 has 6% of float short.

Below, we show all of the charts of these names over the past year and five years. The huge rallies over the past few months are glaring, especially since many of these stocks have been in long term downtrends headed into the COVID pandemic. The strong returns over the past few months have obliterated those downtrends. For others like TSCO, YETI, PII, and MBUU, the longer-term trends have been stronger with uptrends or breakouts of some sideways price action. In the case of PII, an earnings triple play today resulted in the breakout to the upside to a 52-week high. We have created a custom portfolio of all these names to keep track of them in the Trend Analyzer and Chart Scanner tools.


Bespoke Stock Scores — 7/28/20
Bespoke CNBC Appearance (7/27)
Bespoke co-founder Paul Hickey appeared on CNBC’s Closing Bell yesterday to discuss the current state of the markets and company performance based on international exposure. To view the segment, click on the link or image below. Click here to view Bespoke’s premium membership options for our best research available.
Company Performance Based on International Exposure

Bespoke’s Morning Lineup – 7/28/20 – It Doesn’t Get Worse Than This
See what’s driving market performance around the world in today’s Morning Lineup. Bespoke’s Morning Lineup is the best way to start your trading day. Read it now by starting a two-week free trial to Bespoke Premium. CLICK HERE to learn more and start your free trial.
Quote of the Day: “Every time one person buys, another sells, and both think they are astute.” – William Feather
After nearing $2,000 per ounce overnight, gold has sold off pretty sharply. US futures are also lower on some negative earnings reports from the likes of 3M (MMM) and McDonald’s (MCD). The GOP unveiled its proposals to replace the CARES Act, so now the two sides can start to try and come to an agreement (that should be interesting). Data flow today is on the quiet side, but 10 AM’s release of Consumer Confidence will be an interesting one to watch.
Be sure to check out today’s Morning Lineup for a rundown of the latest stock-specific news of note, key earnings news in Europe and the US, trends related to the COVID-19 outbreak, and much more.

When we said it doesn’t get any worse than this, we were referring to the S&P 500’s seasonal trends for the upcoming month based on the last ten years. As shown in the snapshot below from our Seasonality tool, SPY’s median performance from the close on 7/28 through 8/28 has been a decline of 2.40%. Of all the rolling one-month periods throughout the year, the upcoming month ranks worse than every other one.

IPO Pull Back
The Renaissance IPO ETF (IPO) tracks several of the past couple of years’ major initial public offerings. The current class of IPOs that find themselves as a holding of the ETF include many COVID economy stocks that have gone on huge runs like Zoom Video (ZM), Moderna (MRNA), and Slack (WRK) as well as high flying electric vehicle names like NIO (NIO). As shown in the second chart below, that resulted in massive outperformance relative to the S&P 500 (SPY). But more recently, that has lost its footing. On July 13th, IPO saw a sizeable gap up but sold off sharply intraday for an outside day reversal lower. In the days since then, it has put in a lower high and lower low. Additionally, it has broken its uptrend line off of its March lows in the past few days. While that broken uptrend is a negative with regards to the technicals, some mean reversion should be welcome. On Friday, IPO came within 2.2% of its 50-DMA which is the closest it had come since April 22nd. Across all days since it first crossed its 50-DMA back in April, IPO has traded on average 14.3% above its 50-DMA. Click here to view Bespoke’s premium membership options for our best research available.


Daily Sector Snapshot — 7/27/20
Camping World (CWH) Saved by 2020
Along with a huge spike in Google search interest for boats and lawns, another HOT industry in the wake of COVID-19 appears to be camping. As shown below, Google searches for camping are at 5-year highs and holding pretty steady at this higher level over the last month or so.

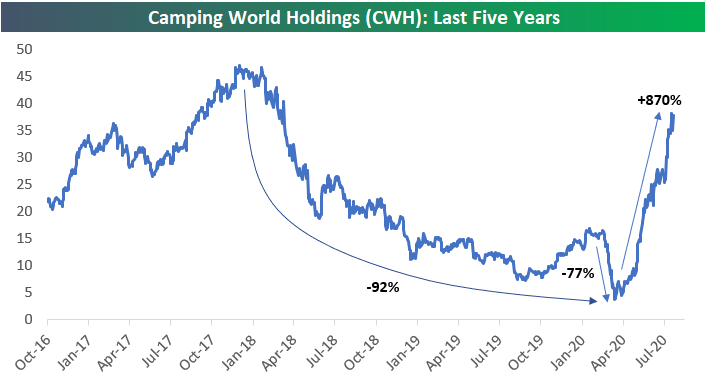
Obviously a beneficiary of a new camping boom would be a stock like Camping World Holdings (CWH). Prior to COVID, Camping World (CWH) appeared to be in pretty big trouble. Shareholders could not have been happy with the 92% decline seen from a high in the mid-$40s at the end of 2017 to $3.40/share when it bottomed in mid-March.
As shown below, since bottoming on March 18th, CWH is up more than 1,000% on an intraday basis and 870% on a closing basis.
What we find most interesting about CWH is how incorrect investors initially were in predicting the impact that COVID would have on the stock. During the COVID crash from mid-February to mid-March, CWH fell 77%. So much for “efficient” markets.
With the share price back into the high $30s from a low in the $3s in less than five months, we doubt there are a lot of major CWH shareholders crying about 2020 the way most others are! Click here to view Bespoke’s premium membership options for our best research available.
Uncertainty Remains in Texas
This morning the Dallas Fed updated its July reading on the manufacturing sector. Overall, the report was mixed showing conditions continue to deteriorate but at a slower rate than earlier this year while businesses remain cautiously optimistic. The reading on general conditions remains negative at -3.0, but that was up from -6.1 in June.
Although current conditions are still weak, companies do not appear to be overly worried about their own futures. While slightly lower this month, expectations for general business activity six months in the future remain positive and the reading for company outlook is likewise positive; rising another 3.2 points this month. This month’s survey also included some special supplemental questions including the following: “Given your current outlook, how likely is it that your business will permanently shut down within the next 12 months?”. To that question, 91.2% reported not likely. Of the remaining respondents, only 3.1% reported that permanent closure is very likely.


While most businesses are not expecting closures and have a generally more optimistic tone, it is perhaps more fitting to say they are cautiously optimistic. While a newer series only dating back to 2018, meaning there is not much history to compare to, the index for the uncertainty of company outlook did rise to 20.9 from 9.1 last month. Although off the highs of the past few months, it remains in the upper end of the range since this question began to be tracked. The commentary section backed this up with comments like: There is still a lot of uncertainty as COVID numbers surge, There are many more ‘what-ifs’ questions to be answered, and We feel uncertainty will remain.

Those results are echoed throughout other individual categories as well. In the table below, we break down the report by each of its components for both current conditions and the six-month outlook. Again, companies seem to be cautiously optimistic with every reading continuing to be positive but several categories falling in July. In terms of current conditions, every category with the exception of General Business Activity, Inventories, and Capital Expenditure are now positive and returning to more historically normal readings. Meanwhile, the indices for inventories and Prices Paid for Raw Materials were the only ones lower in July.

Similar to how the survey results for future outlook are actually a bit mixed, the same can be said for the indices measuring various labor market aspects. The index for employment and hours worked tipped positive in July indicating businesses are on net hiring and increasing hours.

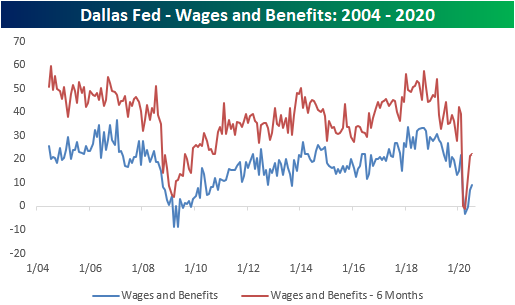
As employment rises so too have wages and benefits, but growth in this area does remain muted. As shown below, while the index for Wages and Benefits is positive indicating companies plan to increase wages and benefits both in the immediate term and six months out, the reading remains lower than most other months over the past decade. In other words, businesses are bringing people back to work and are raising wages, but at a slower rate than pre-COVID. Click here to view Bespoke’s premium membership options for our best research available.