Daily Sector Snapshot — 7/29/20
Qualcomm (QCOM) All-Time Highs
If the first trade you made in 2000 was to buy Qualcomm, congratulations! It’s finally profitable. Learn more about Bespoke Premium.

Bespoke’s Consumer Pulse Report — August 2020
Bespoke’s Consumer Pulse Report is an analysis of a huge consumer survey that we run each month. Our goal with this survey is to track trends across the economic and financial landscape in the US. Using the results from our proprietary monthly survey, we dissect and analyze all of the data and publish the Consumer Pulse Report, which we sell access to on a subscription basis. Sign up for a 30-day free trial to our Bespoke Consumer Pulse subscription service. With a trial, you’ll get coverage of consumer electronics, social media, streaming media, retail, autos, and much more. The report also has numerous proprietary US economic data points that are extremely timely and useful for investors.
We’ve just released our most recent monthly report to Pulse subscribers, and it’s definitely worth the read if you’re curious about the health of the consumer in the current market environment. Start a 30-day free trial for a full breakdown of all of our proprietary Pulse economic indicators.

China Running Away YTD
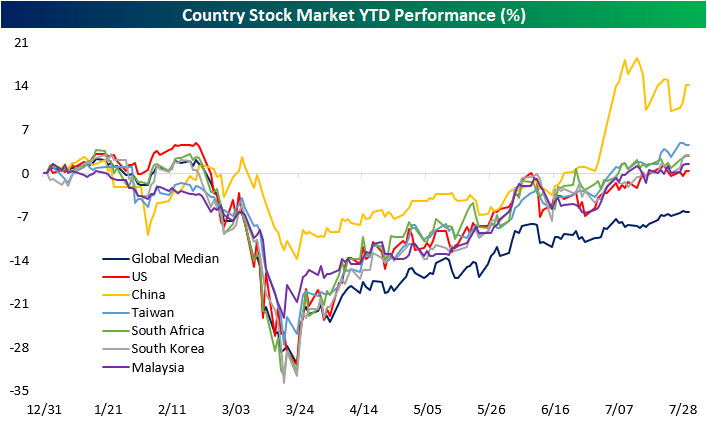
Every Wednesday, we publish our Global Macro Dashboard which provides a high-level summary of market and economic data of some of the world’s largest economies. Of the 23 stock markets tracked, just six including the US are positive year to date at the moment (in local currency). In the chart below we show the YTD performance of these six countries as well as the global median in 2020. As shown, even though it was actually the first to tip into the green YTD following the global sell-off in February and March very briefly back in early June, the US is up the least of this group with a YTD gain of 0.4%. China’s stock market is up the most at +14%. Taiwan, South Korea, South Africa, and Malaysia are also outperforming the US but are up more modestly than China with the best of these, Taiwan, gaining 4.53% this year. Meanwhile, the median country in our Global Macro Dashboard remains down 6.2% YTD.
Given it is up the most on a year to date basis, China has also gained the largest share of global equity market cap in 2020. As shown in the table below, China has gained 1.7 percentage points of global market cap in 2020 and now takes up 10.14%. China now joins the US as the only other country with a double-digit share of total world market cap. Despite this, China has actually lost share since the bear market lows on 3/23. Meanwhile, the US, Germany, Canada, India, South Korea, and Australia have all gained a significant share since 3/23. Start a two-week free trial to Bespoke Institutional to access our interactive economic indicators monitor and much more.

Chart of the Day: FOMC Days Intraday Performance
Tech Takes a Back Seat
For a little over a week now since it last made a new high on 7/20, the Nasdaq Composite has been churning around and consolidating its gains as investors await today’s testimony ahead of Congress from Alphabet (GOOGL), Amazon (AMZN), Apple (AAPL), and Facebook (FB) and then earnings reports from all four companies after the close on Thursday. Needless to say, the next two days will go a long way in defining the backdrop for the Technology sector through the rest of the summer.
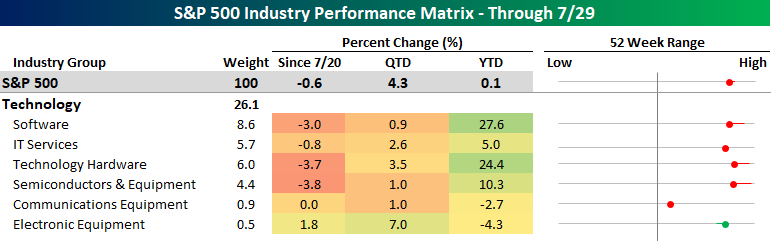
Since the Nasdaq’s high on 7/20, only one of the Technology sector’s six industries has posted positive returns, and it’s also the smallest industry in the sector. While the Electronic Equipment industry has gained 1.8% since 7/20, larger industries like Semis, Tech Hardware, and Software are all down over 3%. While these industries have pulled back a bit over the last week or so, QTD they’re all still in the black, and on a YTD basis, they still remain among the market’s top performers with double-digit percentage gains for all three. On the right side of the image below, we show where each industry is trading relative to its 52-week range, while the tail indicates the change since 7/20. At the Nasdaq’s peak on 7/20, all three industries mentioned above were either at or right near record highs as investors sought growth in a growth starved market.
While Tech has taken a backseat role in recent days, Industrials has been picking up some of the slack. Although the sector has a lot more industries than the Technology sector, it has a much smaller market cap accounting for just 7.9% of the S&P 500 versus Technology’s 26.1% share. Of the twelve industries in the sector, ten are up since the Nasdaq’s peak on 7/20. Leading the way higher, Air Freight, Machinery, Commercial Services, and Building Products have all gained more than 3.5% To the downside, only Airlines and Industrial Conglomerates are in the red since 7/20.
What’s interesting to note about the Industrial sector’s recent performance is that despite the Covid-induced recession, the majority of industries in this sector are much closer to 52-week highs than 52-week lows. The stock market is typically forward-looking, so the recent strength in these cyclical industries suggests that either the market is uncharacteristically clueless or it sees better economic times ahead. Click here to view Bespoke’s premium membership options for our best research available.

Bespoke’s Morning Lineup – 7/29/20 – DC Takes Center Stage
See what’s driving market performance around the world in today’s Morning Lineup. Bespoke’s Morning Lineup is the best way to start your trading day. Read it now by starting a two-week free trial to Bespoke Premium. CLICK HERE to learn more and start your free trial.
Quote of the Day: “Someone’s sitting in the shade today because someone planted a tree a long time ago.” – Warren Buffett
From a business perspective, it’s typically not a great thing when the center of attention on a given day turns to D.C. Unfortunately, that’s the case today for three reasons. First, after each side has outlined its opening demands for the next round of stimulus, Republicans and Democrats will not attempt to work out an agreement. Second, the FOMC. Today at 2 PM the Fed will release their latest decision on interest rates and monetary policy followed by a 2:30 press conference from Chair Powell. If that’s not enough, throughout the day we’ll also have the CEOs of Amazon (AMZN), Alphabet (GOOGL), Apple (AAPL), and Facebook (FB) testifying before the House antitrust committee. Besides members of Congress looking to create a good soundbite for their constituents back home ahead of this Fall’s election, don’t expect much to come from these hearings.
In other news, the flow of earnings has generally remained positive this morning while the pace of economic data will be relatively slow.
Be sure to check out today’s Morning Lineup for a rundown of the latest stock-specific news of note, key earnings news in Europe and the US, trends related to the COVID-19 outbreak, and much more.

In yesterday’s Consumer Confidence report, besides the fact that overall levels of confidence pulled back a bit, sentiment towards the stock market became less optimistic. In each month’s survey, respondents are asked whether they expect stock prices to rise or fall.
In this month’s survey, the percentage of consumers expecting stock prices to decline rose from 29% up to 38.1%. While that’s below the recent peak of 40.6% seen back in March, it’s still elevated relative to readings over the last few years. What’s even more notable about this elevated reading is that it’s incredibly uncommon to have this elevated of a reading with the S&P 500 within 5% of an all-time high. While there are a number of anecdotal stories suggesting frothiness in the market, surveys of average Americans like this one suggest that there’s still no shortage of apprehension.

B.I.G. Tips — Decile Analysis of Act III and Beyond
As we’ve been highlighting over the past month or two, the rally off the March 23rd Covid Crash low has been a three act play. In last Friday’s Bespoke Report, however, we noted that Act III may be coming to an end as we’ve started to see some rotation out of the areas that led the market for most of June and July.
During Act III that began on June 8th and looks to have ended on July 20th, the S&P 500 was almost exactly flat. This came during a period of rising Covid case counts around the country that caused “re-open” stocks to fall significantly while Tech and “Covid Economy” stocks led. Because some of the most notable “Covid Economy” stocks are also the biggest stocks in the world, these names helped prop up the cap-weighted S&P 500 during Act III. Underneath the surface, however, the market was very weak during Act III with the average stock in the S&P falling 5.7%. So Act III was essentially a “flat” pullback if you’re looking for a way to describe it at the index level.

We can use our decile analysis to spot the differences between the action we saw during Act III from 6/8 to 7/20 and the action we’ve seen since 7/20. Below is our decile analysis of the S&P 500 during Act III. To run the analysis, we break the index into deciles (10 groups of 50 stocks each) based on the various stock characteristics shown in the matrix below. We then calculate the average performance of the stocks in each decile from June 8th through July 20th.
Our decile analysis clearly shows that…
To continue reading, start a two-week free trial to Bespoke Premium today.
Daily Sector Snapshot — 7/28/20
Consumer Confidence Experiences a Setback
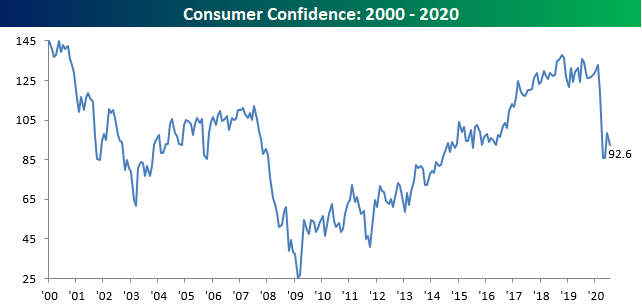
As Covid case counts were rising in the South and Southwest earlier this month, Consumer Confidence took a hit in July as the Conference Board’s Index of Consumer Confidence dropped from 98.3 down to 92.6, which was below the consensus forecast of 95.0. While many economic indicators have seen significant bouncebacks in recent weeks, Consumer Confidence hasn’t been one of them. However, if the recent declines in case counts among many of the problem states continue to recede that could provide a boost to sentiment in August.
Underneath the surface, this month’s report was mixed. While the Expectations component dipped along with the headline inline, the reading on current conditions saw a modest increase.

Due to the diverging paths of the Expectations and Present Situations indices, the spread between the two actually moved back into positive territory. This is notable in that normally once the spread turns meaningfully negative, it takes months for it to bounce back to positive levels.

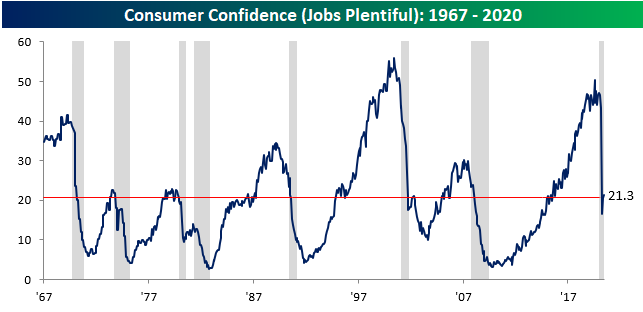
The last item we wanted to highlight is the index of Jobs Plentiful. In July this reading bounced to 21.3 from 20.5. Two things to note with this index concern the recent low reading and the current level. Regarding the recent trough of 16.5, if that low holds, it would be the highest trough for the indicator during and coming out of a recession since the mid-1960s. In terms of the current level, we would note that back in the early 2000s we saw a similar bounce before the index started to roll over again. Based on July’s pullback in the overall headline reading, a rollover in this index next month (like the one in 2002) wouldn’t be a welcome development. Click here to view Bespoke’s premium membership options for our best research available.