Rocketing Restaurants
In Friday’s Bespoke Report sent to members, we noted two groups that have been surprisingly strong performers over the past several months: brick and mortar retailers and restaurants. Focusing on the latter, in the chart below we show the S&P 1500 Restaurants index over the past five years. As shown, up until last week the index’s last high prior to the pandemic actually came well before the rest of the market’s peak in February. The S&P 1500 Restaurants peaked in August of last year and only made a lower high on February 20th before falling over 40% during the course of the COVID Crash in late February and early March. Since the low on March 18th, the index has now risen over 77% and just broke out to a new all-time high.

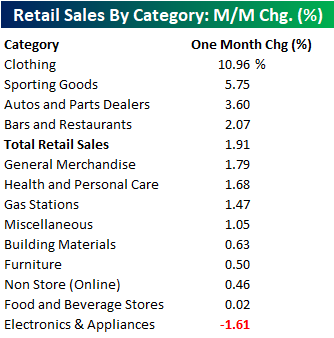
COVID lockdowns and restrictions on in-door dining have impacted the restaurant industry like nothing ever seen before. Based on the monthly Retail Sales report, the Bars & Restaurants category has seen its share of total retail sales fall more than any other group since COVID began, while the Food & Beverage Store (grocery stores) category has been one of the biggest gainers. This is what makes the recovery for the S&P 1500 Restaurants group so noteworthy. While single-location restaurants run by individuals may be having a tough time with capacity limits depending on their geographic location, the publicly-traded restaurant companies with locations throughout the US have seemingly adapted much better in the post-COVID world. That’s what their share prices are telling us at least.

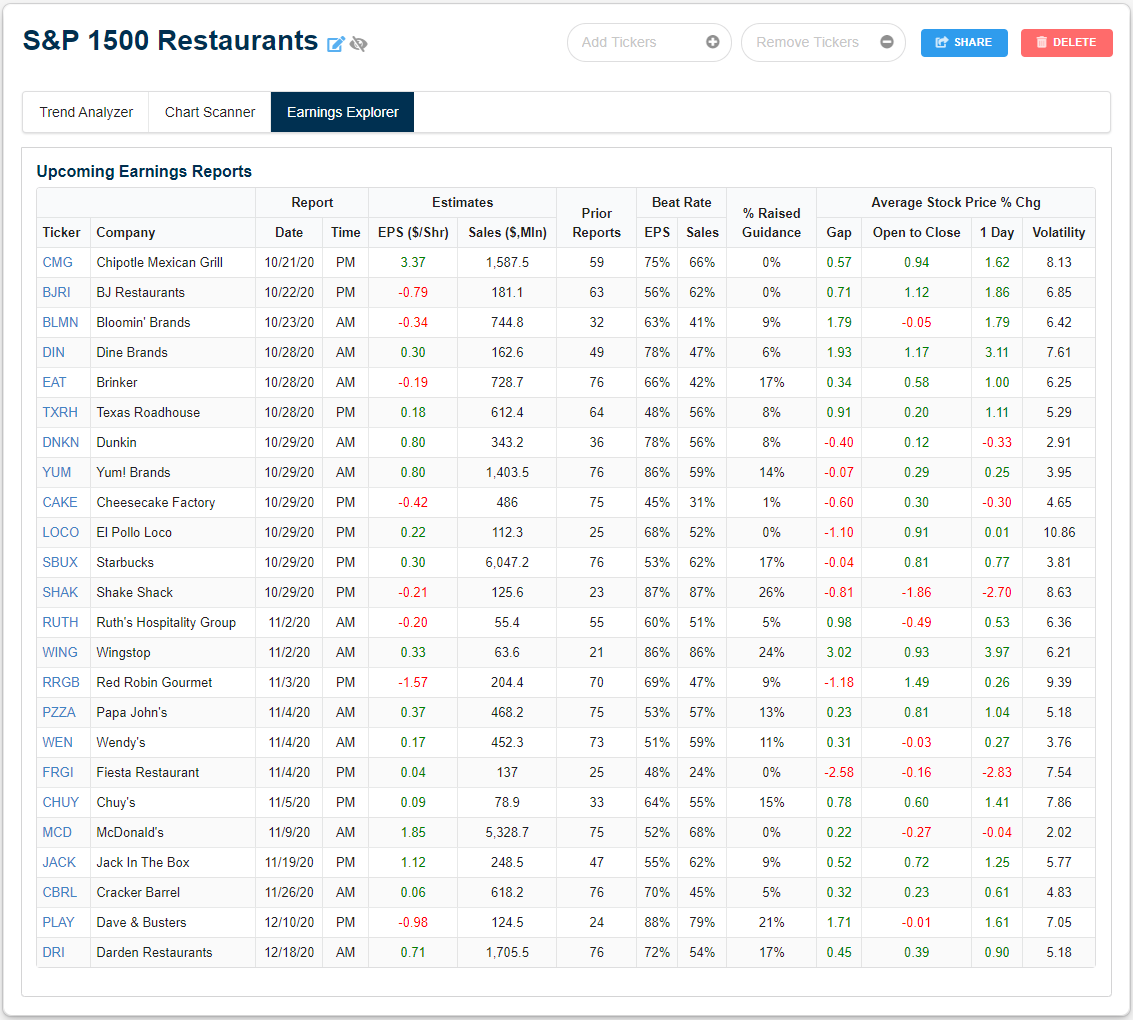
As shown in the table below, nearly all of the stocks in the S&P 1500 Restaurant group made 52-week lows around the time of the broader market bear market low in mid-March. All but four have since seen their stock price double. Brinker (EAT), the parent company of Chili’s, has risen the most since its low having gained well over 500%. Even after those massive rallies, there are still eleven that are down over the past five years and eleven that are down on a year-to-date basis. Dave & Busters (PLAY) and Red Robin (RRGB) are both down by more than 50% in 2020.

Of this group, Domino’s Pizza (DPZ) is the only one that has reported third-quarter earnings so far this earnings season with overall decent results beating on both the top and bottom line. As shown in the screenshot below, we created a Custom Portfolio of these stocks so members can track these names as earnings season carries on. From our Earnings Explorer data, the rest of the stocks in the group are scheduled to release earnings over the next several weeks. Click here to access our Earnings Explorer and Custom Portfolios tool free for the next two weeks.
Bespoke’s Morning Lineup – 10/19/20 – Back to a Million
See what’s driving market performance around the world in today’s Morning Lineup. Bespoke’s Morning Lineup is the best way to start your trading day. Read it now by starting a two-week free trial to Bespoke Premium. CLICK HERE to learn more and start your free trial.
“You can’t have a mid-life crisis in the airline industry because every day is a crisis.” – Herb Kelleher
We hope you enjoyed your weekend because while the economic calendar is relatively light this week, the flow of earnings will pick up in pace as earnings season kicks into high gear. Today, however, is on the quiet side with Homebuilder sentiment the only report scheduled and just a handful of companies reporting earnings.
Be sure to check out today’s Morning Lineup for a rundown of the latest stock-specific news of note, market performance in the US and Europe, key earnings data from the US and Europe, Chinese economic data released over the weekend, trends related to the COVID-19 outbreak, and much more.

The airline industry may always be in crisis but yesterday marked a big milestone for the industry as US total passenger throughput crossed back above the one million level for the first time since March 16th.

Yesterday’s increase in passenger traffic wasn’t just a one-day blip either. On a seven-day average basis, daily passenger traffic has also been steadily rising. Ten days ago, the seven-day average jumped back above the prior post-COVID high of ~780K from early September. Since then, we have seen a steady increase to the current level of ~872K which is nearly 100K above the prior high.

While airline passenger traffic has seen a steady increase off its lows, why aren’t the airline stocks doing better? The reason is that while passenger traffic has been steadily rising, we still have a LONG way to go before things get anywhere near back to normal. The chart below compares the performance of the airline ETF (JETS) to the y/y change in passenger traffic on a seven-day average basis (blue line). The trend is higher but still down by a lot. Yesterday’s million total, for example, was still down over 60% from the same day last year.

Bespoke Brunch Reads: 10/18/20
Welcome to Bespoke Brunch Reads — a linkfest of the favorite things we read over the past week. The links are mostly market related, but there are some other interesting subjects covered as well. We hope you enjoy the food for thought as a supplement to the research we provide you during the week.
While you’re here, join Bespoke Premium with a 30-day free trial!
China
Behind the Stability in China’s Currency: Beijing’s Hidden Hand by Matthew C. Klein (Barron’s)
While official foreign exchange reserve data has been very stable in recent years, the fact that the yuan has traded in an extremely tight range is evidence of interventions by state banks; those interventions are starting to show up in other data as well. [Link]
Can China’s reported growth be trusted? (The Economist)
Private indicators of economic activity have been much more volatile than official indicators. Which is to be trusted? [Link; registration required]
Concerns Abound
Top Fund’s Blacklist Shows ESG Coming for Emerging Markets by Natasha Doff and Selcuk Gokoluk (Bloomberg)
A top-performing bond fund excludes investments that have low ESG ratings, excluding investments in countries like Russia, China, and Saudi Arabia. [Link; soft paywalls]
Ad Tech Could Be the Next Internet Bubble by Gilad Edelman (Wired)
While there are huge questions about the influence of social media networks and their ads on our behavior, some are concerned that the opposite problem is of greater concern: that highly specific targeting of advertisements doesn’t work at all. [Link; soft paywall]
History
Which Constitution Is Amy Coney Barrett Talking About? by Jamelle Bouie (NYT)
An excellent history lesson on the massive changes that Reconstruction brought to the Constitution, with the 13th, 14th, and 15th amendments fundamentally changing the nature of the basic rules of American society. [Link; soft paywall]
One of the Largest Checks Ever (Morgan Stanley/Twitter)
Mitsubishi UFJ invested $9 billion into the collapsing American broker at the height of the financial crisis, leading to a 10-figure check. Here’s the inside story. [Link]
Aliens
Dissolving the Fermi Paradox by Anders Sandberg, Eric Drexler, and Toby Ord (arXiv)
The Fermi Paradox (specifically, given some reasonable assumptions, that there are very high odds that intelligent life exists elsewhere in our galaxy, but there’s no evidence for it) was conclusively disproven back in 2018 to little fanfare. An excellent paper discusses why basic probability theory makes the Drake Equation which the Fermi Paradox rests on useless. [Link]
Rule of Law
‘Straight to Gunshots’: How a U.S. Task Force Killed an Antifa Activist by Evan Hill, Mike Baker, Derek Knowles and Stella Cooper (NYT)
A deep investigation into the killing of a murder suspect by US Marshalls, who opened fire with no verbal warning when they located a man accused of killing a right-wing protestor. [Link; soft paywall]
Birds
‘Jet fighter’ godwit breaks world record for non-stop bird flight by Daniel Boffey (The Guardian)
An absolutely incredible feat of flying saw a migratory bird fly from southwest Alaska to Auckland, New Zealand in 11 days, passing over 12,000 kilometers without touching down for rest or sleep. [Link]
Renewables
Solar-plus-storage replaces coal plant in New Mexico, makes carbon-capture retrofit moot by Tim Sylvia (PV Magazine)
A landmark deal in New Mexico shows how cheap solar has gotten, with multiple installations of production and storage (in batteries) at prices that make coal completely uncompetitive. [Link]
Media Matters
An Arrest in Canada Casts a Shadow on a New York Times Star, and The Times by Ben Smith
The high profile New York Times audio project Caliphate has largely unraveled after its central source was arrested in Canada for violations of the country’s hoax law. [Link; soft paywalls]
COVID Business
Covid Recession Spawning Entrepreneurs in U.S. Amid Joblessness by Michael Sasso and Alexandre Tanzi (Bloomberg)
Business formations are exploding in the wake of the COVID recession, a big difference from the post-financial crisis period, and one we also discussed this week on the blog. [Link; soft paywall]
Is this how theater gets saved? Geffen magic show mines virtual box-office gold by Jessica Gelt (LAT)
Theaters are turning to magic shows broadcast via Zoom to keep the lights as the pandemic prevents Americans from gathering for performances. [Link; soft paywall]
Encore at Wynn Las Vegas changes operating hours due to low demand (KLAS)
After re-opening, Wynn’s Encore property will reduce operating hours thanks to low demand for gambling and other amenities. [Link; auto-playing video]
The Bitter End and Other Concert Venues Say They Won’t Survive Without a Bailout by Lucas Shaw (Bloomberg)
Clubs and bars in New York are at the end of their rope as restrictions on patronage and the general lack of demand for crowded indoor spaces put the industry into dire straits. [Link; soft paywall]
Quarantine Blues
It’s been 214 days since Disneyland closed. For these superfans, it’s agony by Lisa Boone (LAT)
Disneyland remains closed, and that’s been a brutal experience for Disney superfans who have spent years making regular visits to the park. [Link; soft paywall]
Goodbye, Sunny Florida. Hello, Frigid Winter. Covid Strands Canadian Snowbirds. by Paul Viera (WSJ)
“Snowbirds” are Canadians who spend the frigid winters of the Great White North in sunnier, warmer American climes. But border closures and the COVID epidemic mean the million Canadians who fly south for the winter won’t be doing so this year. [Link; paywall]
Teens Did Surprisingly Well in Quarantine by Jean M. Twenge (The Atlantic)
Despite concerns that lockdowns would be extremely hard on young people, teenagers appear to have done better or about the same in terms of mental health in 2020 relative to a similar assessment in 2018. [Link; soft paywall]
Rational Pragmatism
Emily Oster’s Pandemic Parenting Guidance Is All About the Data by Esmé E. Deprez (Bloomberg)
A Brown university economist has developed a huge following by boiling down complex risk families face in dealing with COVID-19. [Link, soft paywall]
The real lessons from Sweden’s approach to covid-19 (The Economist)
Sweden is neither a libertarian paradise nor a herd immunity-seeking disaster, but a pragmatic, high-trust example of how strong social cohesion can help fight COVID. [Link]
Read Bespoke’s most actionable market research by joining Bespoke Premium today! Get started here.
Have a great weekend!
The Bespoke Report — COVID Economy Chugging Along
Daily Sector Snapshot — 10/16/20
University of Michigan Mixed Again
The University of Michigan reported preliminary consumer sentiment numbers for October. University of Michigan data has shown a much smaller bounce than other sentiment surveys, but the preliminary numbers for October did increase versus September. The strongest part of the survey was expectations, which has risen three months in a row to the highest levels since March. Consumers’ current assessment of the economy fell sequentially and is sitting at about the same place it was back in early 2012.

One feature of the University of Michigan poll with incomplete data prior to 2016 but more complete data since is a breakout of economic sentiment by political party affiliation. As shown below, their data shows Republicans getting a massive sentiment boost in the wake of the 2016 election. The key here though, is that the boost to the sentiment of Republicans and the decline for Democrats came after the election as this data is definitely lagging to political outcomes rather than leading. Click here to view Bespoke’s premium membership options for our best research available.

B.I.G. Tips – Retail Sales Rebound
After a disappointment last month, Retail Sales saw a nice rebound in September as consumers seem undeterred from spending despite the expiration of extended UI benefits and the lack of an additional stimulus bill. For the month of September, headline Retail Sales rose 1.9% m/m versus expectations for a more modest increase of 0.8%. Ex Autos and Gas, growth was even better relative to expectations, although August’s already slower than expected growth was revised modestly lower.
Breadth in this month’s report was strong. Of the thirteen sectors that comprise the total pie, all but one of them (Electronics and Appliances) showed growth. Normally, when a sector shows m/m growth of a percent or two, it’s impressive. This month, though, the volatility of the pandemic remains in place as two sectors showed growth of over 5%, including Clothing which saw double-digit growth relative to August!
While the monthly pace of retail sales is back at all-time highs, the characteristics behind the total level of sales have changed markedly in the post COVID world. In our just-released B.I.G. Tips report, we looked at these changing dynamics to highlight the groups that have been the biggest winners and losers from the shifts. For anyone with more than a passing interest in how the COVID outbreak is impacting the economy, our monthly update on retail sales is a must-read. To see the report, sign up for a monthly Bespoke Premium membership now!
Bespoke’s Morning Lineup – 10/16/20 – Retail Sales Shine
See what’s driving market performance around the world in today’s Morning Lineup. Bespoke’s Morning Lineup is the best way to start your trading day. Read it now by starting a two-week free trial to Bespoke Premium. CLICK HERE to learn more and start your free trial.
“My main life lesson from investing: self-interest is the most powerful force on earth.” – Jesse Livermore
Retail sales have helped to push a modestly positive tone in the futures market even higher. Headline retail sales showed growth of more than double economists forecasts (1.9% vs 0.8%), and ex Autos as well as Ex Autos and Gas, the beat relative to expectations has been even stronger.
Be sure to check out today’s Morning Lineup for a rundown of the latest stock-specific news of note, market performance in the US and Europe, key earnings data from the US and Europe, trends related to the COVID-19 outbreak, and much more.
While the week is looking to finish off on a positive note, performance over the last week (since last Thursday’s close) sure has been mixed. The sector snapshot from our Trend Analyzer shows that while six sectors have moved higher in their trading ranges over the last week, five have declined. Tech has been the clear leader on the week rising more than 2.5%, followed by Consumer Discretionary (1.61%), Consumer Staples (1.41%), and Communication Services (1.33%). On the downside, the only two sectors that are down more than 1% over the last five trading days are Real Estate and Energy (what else is new?).
Relative to their trading ranges, Industrials and Utilities are the only two sectors that are trading at ‘Extreme Overbought” levels, while Technology, and both Consumer sectors are merely overbought. Every other sector is neutral and Energy is the only sector below its 50-day moving average.

2020 Elections: Strong Turnout Ahead
Betting markets sites like Election Betting Odds and poll aggregators like FiveThirtyEight or The Economist are all diligently predicting who wins the 2020 election, but almost as interesting to watch is voter participation. We won’t be doing any forecasting on election outcomes in this post; there are lots of arguments both ways about which candidate or party might benefit from changes in overall voter turnout, and we’re not equipped to answer them. But we do feel like 2020 being a very strong turnout year is a safe bet.
So far, over 17 million voters have already cast their ballots among the 36 states reporting early vote and/or mail-in ballot tallies per U.S. Elections Project. Patterns of early voting activity vary widely across states thanks to different rules and timelines for mail-in or early voting. Of the 36 states for which data exists, four have ballots cast at less than 5% of 2016 levels. In contrast, Vermont has already seen more than a third of 2016 votes cast submitted early. Texas, which has limited mail voting and is just two days into early voting, has already seen nearly 20% of 2016 votes cast. California’s mail-heavy system is above 10%.

So is that an unusual number of pre-election votes cast? In a word, yes. Data from TargetSmart, a Democratic Party-aligned analytics firm, shows total early voting is running at a pace roughly six times what it did in recent Presidential years. Of course, the COVID-19 pandemic is driving more folks to mail their votes in, so maybe the huge numbers of early and mail-in voters aren’t showing an actual turnout surge. But other leading indicators do support the idea that 2020 will see strong participation.
One example is midterm participation from 2018. The last midterm election saw the highest voter turnout since 1970 per the U.S. Elections Project. Historically, prior midterm turnout isn’t a great indicator for Presidential year turnout, but there is some co-movement.

A better example is Gallup surveys asking people how enthusiastic they feel about upcoming elections versus past elections. As shown in the chart below, the spread between the two tends to be a pretty good predictor of overall turnout in Presidential elections since 1996; the only major departure was 2016, when the Gallup measure substantially undershot overall turnout. This makes a very compelling case that Americans are set to vote in relatively large numbers.

If the Gallup numbers are correct, and the early vote numbers are certainly consistent with them, then this would be the highest turnout year since 60.7% of Americans voted in the 1968 election of Richard Nixon (Republican), higher even than the 2008 election of Barack Obama (Democrat). Stay on top of major election trends and their impact on the financial markets with a Bespoke. Click here to view Bespoke’s premium membership options for our best research available.
