Bespoke’s Morning Lineup – 12/27/19 – Nasdaq Goes For 12
See what’s driving market performance around the world in today’s Morning Lineup. Bespoke’s Morning Lineup is the best way to start your trading day. Read it now by starting a two-week free trial to Bespoke Premium. CLICK HERE to learn more and start your free trial.

The Closer – FICC Recap, Transport Data Mixed, Strikes Surge – 12/26/19
Log-in here if you’re a member with access to the Closer.
Looking for deeper insight on markets? In tonight’s Closer sent to Bespoke Institutional clients, we take a look at the action in Treasuries and the dollar. We also review the continued rally for crude oil. Next, we review truck and rail transportation data before finishing with a look at the impacts strikes and other worker stoppages have had this year.

See today’s post-market Closer and everything else Bespoke publishes by starting a 14-day free trial to Bespoke Institutional today!
Chart of the Day: This One Goes to 11
Sentiment Less Extended
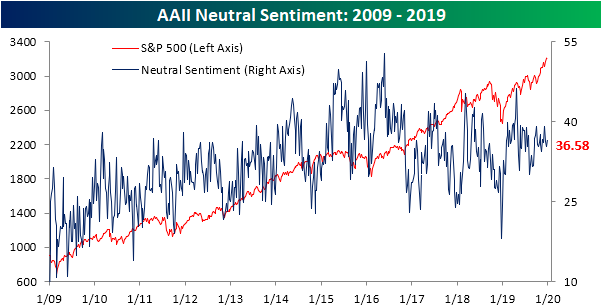
As the major indices continue to establish fresh record highs in the past week with the Nasdaq eying an eleventh consecutive up day today, sentiment has actually not shared in moving higher. The reading on bullish sentiment from the AAII fell this week down to 41.89% from 44.1% last week. Although it is still elevated, currently in the 96th percentile of the past year’s readings, bullish sentiment is less extended than last week and is now back within one standard deviation of its historical average.

As could be expected, the drop in optimism has led to a slight increase in those reporting as bearish. Bearish sentiment rose just about 1 percentage point this week to 21.53%. As with bullish sentiment, while off of the lowest levels, bearish sentiment is still low relative to where things have stood recently with this week’s print in the bottom decile of the past year’s readings.

Neutral sentiment also borrowed from the losses in bullish sentiment as it rose to 36.58%. While bullish and bearish sentiment levels are at some of their highest and lowest levels of the past year, respectively, the small increase this week in neutral sentiment only leaves it in the middle of its recent range. Start a two-week free trial to Bespoke Institutional to access our interactive economic indicators monitor and much more.
B.I.G. Tips – Death by Amazon – 12/26/19
Our “Death By Amazon” index was created many years ago to provide investors with a list of retailers we view as vulnerable to competition from e-commerce. In 2016, we also created our “Amazon Survivors” index which is made up of companies that look more capable of dealing with the threat from online shopping. To see how the two indices have been performing lately and view the full list of stocks that make up the indices, please read our newest report on the subject available to Bespoke Premium and Bespoke Institutional members.
To unlock our “Death By Amazon” and “Amazon Survivors” indices, login or start a two-week free trial to either Bespoke Premium or Bespoke Institutional.

Claims Continue to Moderate
Just two weeks ago, initial jobless claims came in at one of the highest readings in recent years at 252K. In the two weeks since then, claims have moderated, returning to levels that are more in line with where they have been in the past year. This week, claims were expected to fall to 220K, instead, they came in slightly worse at 222K this week from 235K last week.

While seasonally adjusted claims have moved lower over the past couple of weeks, the four-week moving average has continued to grind higher for its third consecutive week. With a reading of 213K rolling off the average and replaced by this week’s 222K reading, the four-week moving average now sits at 228K. That is the highest level for the moving average since mid-February when it was 229.5K. While just 1.5K off of the 52-week highs for the moving average, it is also 26.5K off of the 52-week low of 201.5K from April. That is the furthest from the 52-week low that the moving average has been since September of 2017 when it was 37K above its 52-week low.

As is the seasonal norm, non-seasonally adjusted claims rose this week to 284.8K from 270.4K last week. This time of year typically sees claims increases until their annual peak which usually occurs in the first couple of weeks of the new year. Start a two-week free trial to Bespoke Institutional to access our interactive economic indicators monitor and much more.

The Bespoke 50 Top Growth Stocks — 12/26/19
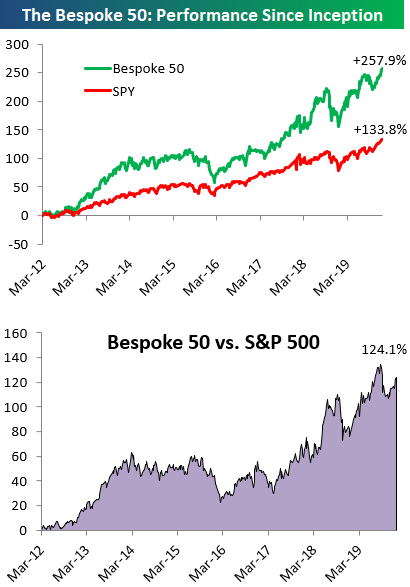
Every Thursday, Bespoke publishes its “Bespoke 50” list of top growth stocks in the Russell 3,000. Our “Bespoke 50” portfolio is made up of the 50 stocks that fit a proprietary growth screen that we created a number of years ago. Since inception in early 2012, the “Bespoke 50” has beaten the S&P 500 by 119.0 percentage points. Through today, the “Bespoke 50” is up 251.0% since inception versus the S&P 500’s gain of 132.0%. Always remember, though, that past performance is no guarantee of future returns. To view our “Bespoke 50” list of top growth stocks, please start a two-week free trial to either Bespoke Premium or Bespoke Institutional.
Prices at the Pump Following the Seasonal Script
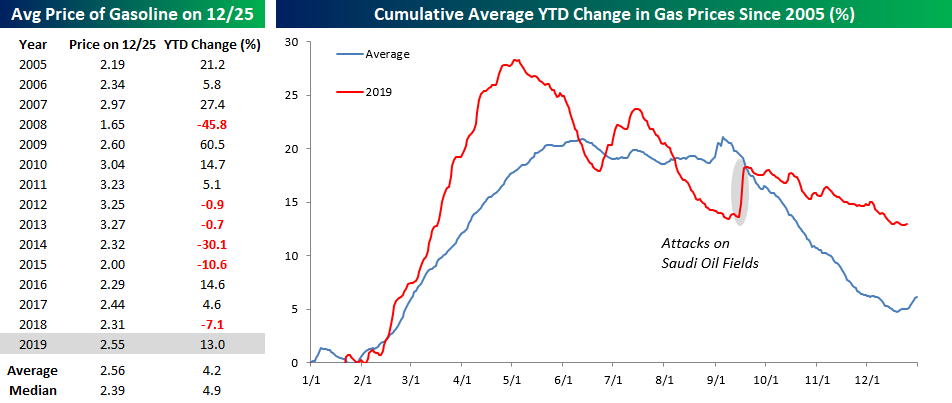
For many Americans, gas prices are a big part of the annual budget, and while this year saw an above-average increase in prices at the pump, the actual price levels are right in line with their historical average. The table below shows the average price level and YTD percent change in gas prices over each of the last 15 years. At a level of $2.55 per gallon, the national average price of gasoline is a penny less than the historical average going back to 2005 and 16 cents above the median level of $2.39. In terms of the YTD change, though, this year’s gain of 13% is triple the 4.2% average for all years.
The chart to the right of the table compares the change in gas prices this year to a composite of the historical average dating back to 2005. For the most part, this year’s path of prices followed the historical trend. The key difference, though, is that prices in the Spring this year saw a much larger than average increase. Once prices peaked in April, they started to decline at a faster than average pace and were actually up less than average by late summer. Following the attacks on the Saudi oil fields in September, though, the YTD change moved back above the historical average and has stayed there ever since.
The chart below shows the y/y change in gas prices since 2006. With a 10.4% increase compared to this time last year, the y/y change is currently the highest since late 2018, although by historical standards the current level is nowhere near an extreme. Sign up for Bespoke’s “2020” special and get our Bespoke Report 2020 Market Outlook and Investor Toolkit.

Most Wonderful Day of the Year
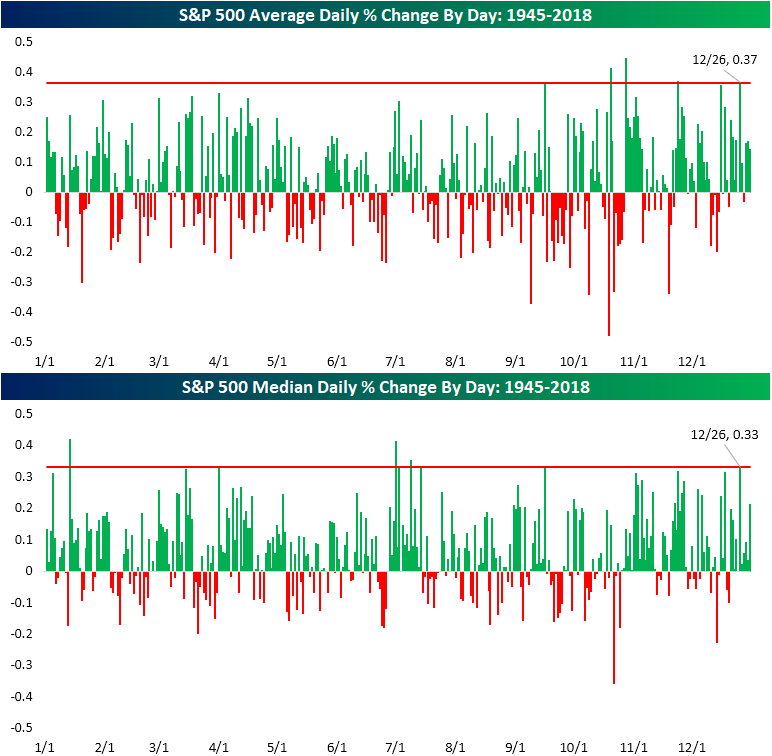
For the S&P 500, Santa comes a day late but not a buck short. As shown in the chart below and as we discussed in the seasonality section of the 2020 Outlook Report, the day after Christmas, December 26th, has been the day of the year that has most consistently seen the index finish higher. Of all December 26’s since 1945, the S&P 500 has closed higher 78% of the time. The next best days of the year have been November 24th and August 17th which have also gained more than three-quarters of the time. That is significantly better than the average for all days of the year which is just 53.07%.

In terms of the actual performance of the index, 12/26 is also one of the best days of the year on both an average and median basis. In fact, on average, the S&P 500 has closed up 0.37% on 12/26; the fourth best day of the year. As shown below, the only days of the year that have averaged better returns are 10/20, 10/28, and 11/24. October 28th is the best of these with a 0.44% gain.
In regards to the median performance, the day after Christmas is still in a top spot as the fifth best day of the year, typically rising 0.33%. The only stronger days of the year are 1/14, 4/1, 7/1, and 7/9. Of these days, 1/14 has been the strongest performer with a gain of 0.42%.
In the chart below, we created a composite intraday chart of the S&P 500 on December 26th since 1983 when data begins. As shown, pretty much through the entire day the index grinds higher with particular strength at the start of the day and in the final half-hour. Join Bespoke Premium now for our most actionable insights and market analysis. CLICK HERE to start a two-week free trial.

Bespoke’s Morning Lineup – 12/26/19 – Is Anybody Out There?
See what’s driving market performance around the world in today’s Morning Lineup. Bespoke’s Morning Lineup is the best way to start your trading day. Read it now by starting a two-week free trial to Bespoke Premium. CLICK HERE to learn more and start your free trial.
The image below is from our Trend Analyzer tool and shows where each of the S&P 500 sectors is trading relative to their trading ranges. While most sectors are overbought at the moment, Industrials (XLI) are just shy of overbought levels and the Real Estate sector (XLRE) is actually trading slightly below its 50-DMA. Despite being below its 50-DMA, though, XLRE has been the best performing sector over the last week, while Financials (XLF) is the only sector in the red.
