The Bespoke Report — Laboring Into Labor Day
This week’s Bespoke Report newsletter is now available for members.
The Nasdaq 100 was more than 30% above its 200-day moving average on Wednesday, which was the most extended it has been above its 200-day since the Dot Com boom of the late 1990s. Even after a big two-day pullback to close out the week, the Nasdaq 100 remains 22% above its 200-day. You know an index is extended when a bear market decline of 20% wouldn’t even put it below its 200-day!

In this week’s Bespoke Report, we analyze the market’s drop over the last two days and try to determine whether it’s the start of a longer-lasting correction or simply a blip within a long-term uptrend.
We also take a look at this week’s big economic releases, including Friday’s better-than-expected Nonfarm Payrolls report and the monthly ISM manufacturing and services readings for August.
We close the report with a deep dive into each of our Bespoke Model Portfolio holdings. If you want to know why we like each of the stocks in our most popular growth portfolio, this week’s report provides a detailed look.
To read this week’s Bespoke Report newsletter and access everything else Bespoke’s research platform has to offer, start a two-week free trial to one of our three membership levels. You won’t be disappointed!

Daily Sector Snapshot — 9/4/20
Airports Getting a Little More Crowded
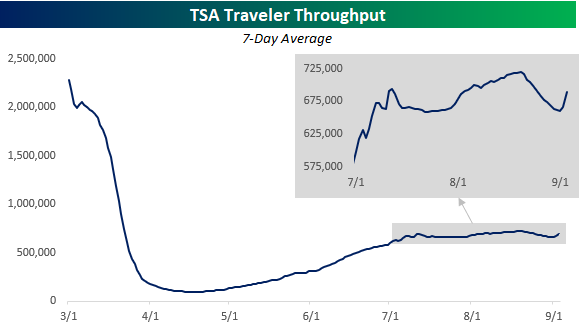
Recent economic data has been making a habit of surprising to the upside as the pace of recovery from the pandemic lows has consistently surprised most economists. While improved, the picture isn’t perfect. This morning’s non-farm payrolls report, which was better than expected at the headline level, showed a concerning increase in the number of permanent job losses (people looking for work that left their prior job on an involuntary basis). Also, looking at more real-time indicators of activity like TSA passenger throughput at the country’s airports appears to have leveled off after rising off the lows in May and June. This begs the question, has the low hanging fruit been fully harvested?
In some ways, the answer to this question is yes. In March and April, pretty much everything shut down. As awareness of the virus and how to deal with it grew, though, businesses that were little impacted have resumed operations. While those businesses have resumed activity, there are still a number of businesses such as ones in the travel, leisure, beauty, and hospitality sectors that remain weak in part because the demand hasn’t returned but also because government orders prohibit them from re-opening in full or even at all. As concerns from the public start to ease and restrictions are lifted, these sectors should also start to improve.
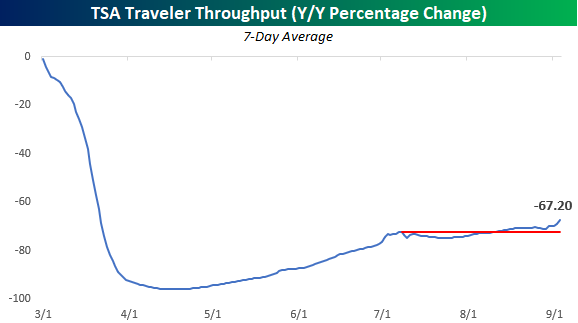
While the pace of the recovery has slowed, it doesn’t yet appear to be rolling over. Take the passenger data in the chart above. While it appears to have stalled out in the last two months, part of the decline is the result of seasonal factors. The chart below takes the same data as the chart above but compares the throughput levels to where they were a year ago and shows the y/y percentage change. On this basis, passenger traffic is still down an eye-popping 67% compared to a year ago, but yesterday’s level was actually the highest reading since late March and has actually been accelerating to the upside. It’s possible that where Labor Day falls on the calendar this year could be impacting the y/y change, so we’ll have to see where things shake out in the next week, but even with that caveat, the pace of air traffic looks better on a y/y basis than on an absolute basis. Like what you see? Try out a Bespoke subscription to receive our weekly Bespoke Report in your inbox this evening. Click here to start a two-week free trial now!
August 2020 Headlines
B.I.G. Tips – S&P 500 2%+ Declines From a Record High
Bespoke’s Morning Lineup – 9/4/20 – Let’s Try This Again
See what’s driving market performance around the world in today’s Morning Lineup. Bespoke’s Morning Lineup is the best way to start your trading day. Read it now by starting a two-week free trial to Bespoke Premium. CLICK HERE to learn more and start your free trial.
“The eyes are more exact witnesses than the ears.” – Herclitus
Yesterday was an ugly day, although many people we spoke with were surprised that both the S&P 500 and Nasdaq had similar but larger reversals back in June, so it’s not as though the move was unprecedented. There’s no arguing the market was a bit frothy, especially in large-cap tech, heading into Thursday’s rout, so some mean reversion is to be expected.
In the short-term, the worst may not be over for big-tech. It remains the most overbought sector of the market, and continued tensions with China, the latest being reports that the country will increase support for its domestic semiconductor industry, only adds to the tensions.
In Europe, the region is seeing its second straight day of disappointing economic data. The focus for the short-term in US markets, though, is the August Non-Farm Payrolls report. Economists were expecting 1.35 million jobs, the Unemployment Rate is expected to drop back below 10% to 9.8%, and average hourly earnings are expected to remain unchanged. The actual results were much stronger than expected. While job creation was only slightly better than expected (1.371 million), the Unemployment Rate dropped to 8.4%, and Average Hourly Earnings increased 0.4%.
Be sure to check out today’s Morning Lineup for a rundown of the latest stock-specific news of note, market performance in the US and Europe, trends related to the COVID-19 outbreak, and much more.

As mentioned above, even after yesterday’s sell-off, many sectors remain overbought. In fact, the only sectors not trading more than a standard deviation above their 50-day moving averages (DMA) are Utilities, Health Care, and Energy. Energy is also the only sector currently trading below its 50-DMA, while Technology is still trading 7.2% above its 50-DMA, which ranks third of the eleven sectors just slightly behind Communication Services (+7.24%) and Consumer Discretionary (+7.23%).

Under The Surface, The Labor Market Weakened In August
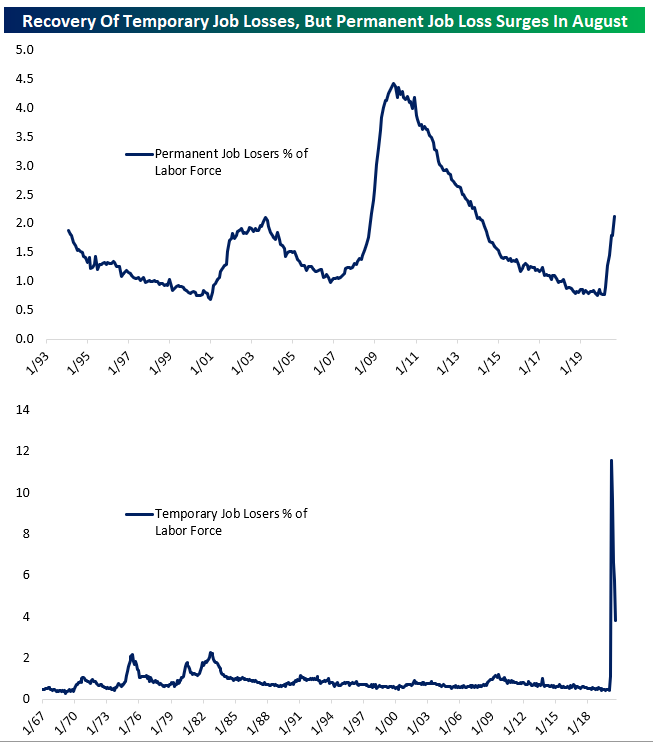
Headline statistics from the Bureau of Labor Statistics Employment Situation Report on Friday morning showed further labor market recovery from COVID. But under the surface, August had significant labor market deterioration. While payrolls beat, the unemployment rate fell faster than expected, wages were stronger than expected, and hours worked rose against expectations, the number of Americans who are on permanent layoff (involuntarily unemployed and looking for work) rose by more than 500,000, and their share of the overall labor force is now the same as during the peak of the early-2000s recession.
While the huge drop in temporarily laid-off workers that has been ongoing for several months continued, widening of permanent job loss suggests that the labor market is still deteriorating as businesses close, reduce output, or are forced from re-opening thanks to the ongoing economic impact of COVID. While the headline numbers were welcome, it’s important to understand that they don’t tell the full story. Please note both charts below show data for all periods it is available. For more on the jobs report, try out a Bespoke subscription to receive our weekly Bespoke Report in your inbox this evening. Click here to start a two-week free trial.
The Bespoke 50 Top Growth Stocks — 9/3/20
Every Thursday, Bespoke publishes its “Bespoke 50” list of top growth stocks in the Russell 3,000. Our “Bespoke 50” portfolio is made up of the 50 stocks that fit a proprietary growth screen that we created a number of years ago. Since inception in early 2012, the “Bespoke 50” has beaten the S&P 500 by 154.0 percentage points, which hit a new high this week. Through today, the “Bespoke 50” is up 304.8% since inception versus the S&P 500’s gain of 150.8%. Always remember, though, that past performance is no guarantee of future returns. To view our “Bespoke 50” list of top growth stocks, please start a two-week free trial to either Bespoke Premium or Bespoke Institutional.

Bespoke’s Weekly Sector Snapshot — 9/3/20
All or Nothing Days Make a Comeback
For those unfamiliar with the term, we consider an “all or nothing day” to be one where the S&P 500’s net daily A/D (advance/decline) reading is greater than +/-400. Earlier this year when the market was going haywire due to the COVID outbreak and subsequent lockdowns, all or nothing days were occurring nearly every other day. In the 50 trading days from 2/21 through 5/1, there were a total of 22 all or nothing days, which works out to 44% of trading days. Going back to 1990, there were only two other periods where the percentage of all or nothing days was higher. The first was in the 50 days ending 12/5/08 while the highest frequency of all or nothing days over a 50-day period was in the second half of 2011. After a 45-trading day lull with no occurrences, all or nothing days are attempting a comeback as the S&P 500 has now seen back to back all or nothing days for the first time since March

As far as for where the frequency of all or nothing days this year ranks compared to other years, 2020 already ranks in the top six of all years since 1990, and there are still nearly four months left to go! If the current pace of all or nothing days this year keeps up through year-end (a big if given that these types of days tend to occur in bunches), 2020 would see a total of 49 all or nothing days, and that would rank as the third-highest for all years since 1990 (2011 – 70 and 2008 – 52). With fall and the most volatile time of the year now upon us, we may just get there. Click here to view Bespoke’s premium membership options for our best research available.
