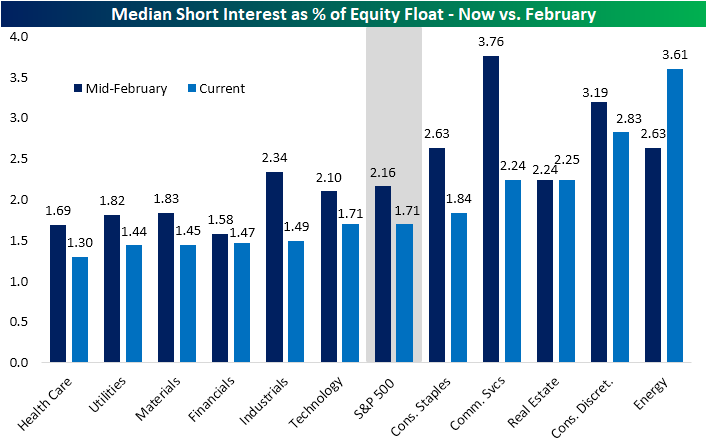
Most and Least Heavily Shorted Stocks in the S&P 500
Over the past several months, short interest has gradually headed lower. On a median basis, short interest as a percentage of float for stocks in the S&P 500 is just 1.71%. That compares to 2.16% in mid-February, just a few days below the equity market’s peak prior to the bear market. On a sector basis, short interest as a percentage of the float is generally lower for almost every sector now than it was back in February. For some sectors like Industrials and Communication Services, the differences between now and then are dramatic. But short interest has not declined for every sector. Both the Real Estate and Energy sectors currently have higher median short interest readings than they did earlier this year, and in the Energy sector, the median short interest has increased nearly a full percentage point.
Despite the Energy sector boasting the highest median reading, on an individual stock basis, not a single Energy name finds itself on the list of the 25 S&P 500 stocks with the highest short interest. In fact, the Energy stock with the most elevated reading is Marathon Oil (MRO) at just 6.7%; which ranks 42nd in the S&P 500. While the beaten-down sector does not have any representation in the top 25 list, the list is mostly comprised of companies that have similarly been battered by COVID-19. Stocks related to the reopening trade like travel, airlines, and retail dominate this list. While these high readings of short interest indicate a large number of investors betting against these names, from a contrarian perspective, they are names that could be susceptible to a short squeeze.
Looking at the inverse, most of the 25 stocks in the S&P 500 with the lowest short interest as a percentage of float are made up of stocks that have held up better this year. There are some big large-cap names like Apple (AAPL) and Microsoft (MSFT) as well as some names that have seen their business boom since the pandemic began such as Home Depot (HD) and Costco (COST). The sector with the lowest median short interest as a percent of float, Health Care, is also well represented with 8 of the 25 stocks finding their way onto the list. Click here to view Bespoke’s premium membership options for our best research available.

Chart of the Day – First Impressions. Do They Matter?
A Month to Be Thankful For
Heading into today with just three trading days left in November, the average Russell 1,000 stock was up 17.44% month to date. As shown below, not one of the five largest stocks is up even close to 17% on the month. For a market that had recently been driven higher in large part because of the five mega-cap Tech names, November has seen the mega-caps stall a bit while the rest of the market has seen broad participation. This is the type of breadth that market bulls have been waiting and hoping for.
Of the 35 largest stocks in the Russell 1,000, Tesla (TSLA) is up the most so far this month with a gain of 43%. The other big winners include Chevron (CVX), JP Morgan (JPM), Bank of America (BAC), Disney (DIS), and Comcast (CMCSA). Not one stock in the top 35 is down on the month, but the ones that are up the least are Netflix (NFLX), Procter & Gamble (PG), Amazon (AMZN), and Home Depot (HD).

Looking at sectors, the average Energy stock in the Russell 1,000 is up 46% month-to-date but still down 27% year-to-date. Three other sectors have seen their stocks average MTD gains of more than 20%: Financials, Industrials, and Real Estate. Stocks in the Health Care and Utilities sectors are up the least on an average basis this month, but even these underperformers are still up more than 5%.

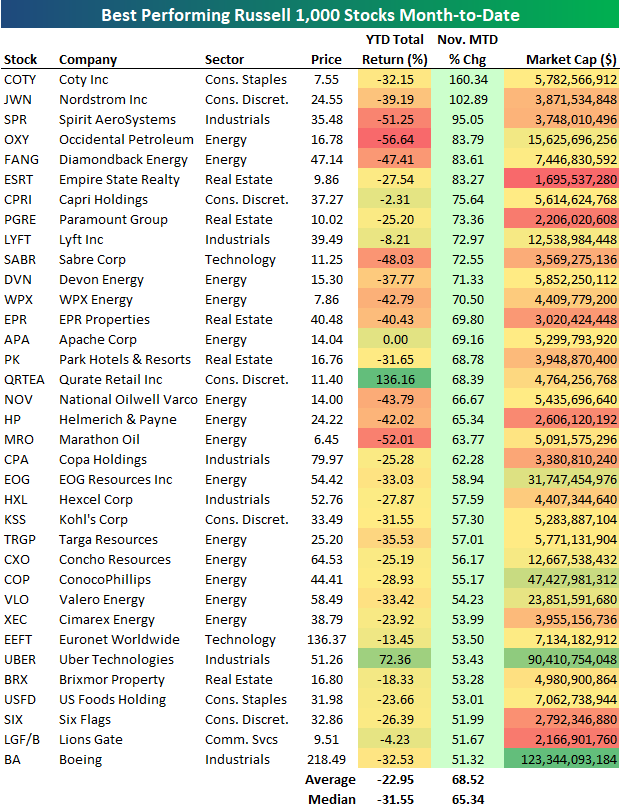
There are 37 stocks in the Russell 1,000 up more than 50% so far in November. Below is a list of this month’s biggest winners. Coty (COTY) and Nordstrom (JWN) stand out the most with gains of more than 100%, followed by Spirit AeroSystems (SPR), Occidental Petroleum (OXY), Diamondback Energy (FANG), and Empire State Realty (ESRT). The list of biggest winners this month is full of names that got hit hardest by COVID in areas like energy, travel, retail, and real estate. Notably, while these stocks are up an average of 68.5% in November, they’re still down an average of 23% on the year. On a median basis, they’re down even more year-to-date at -31.55%. Click here to see Bespoke’s premium membership options and start a free trial for instant access to our research and interactive tools.
Disappointing Claims But Seasonality a Factor
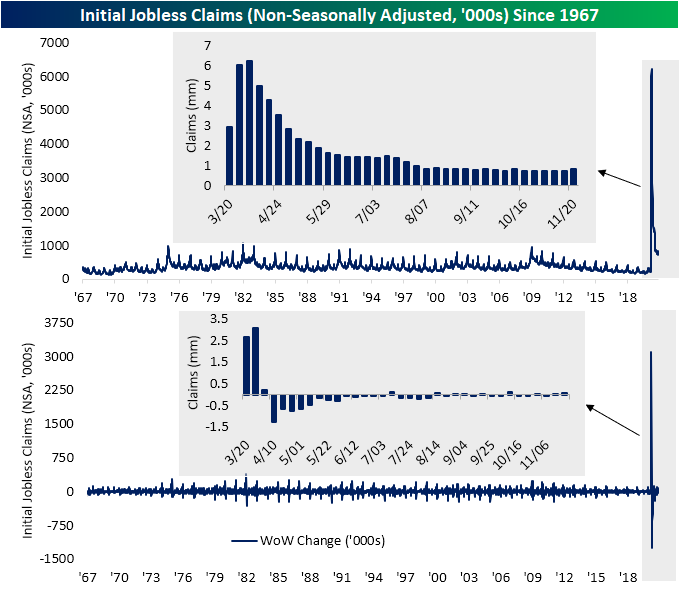
Initial jobless claims were expected to improve this week, falling from an upwardly revised 748K last week down to 730K. Instead, claims came in worse than expected, rising for a second week in a row totaling 778K. That is the highest level in claims since the week of October 16th. On the bright side, this week’s 30K increase was smaller than last week’s 37K uptick.

On a non-seasonally adjusted basis, initial jobless claims likewise rose this week, increasing by 78.4K to 827.7K. That is the highest level and the first time claims have come in above 800K since the week of October 9th when claims stood slightly higher at 829.7K. While claims have moved higher over the past couple of weeks, we would note that claims moving higher is the normal seasonal trend for this time of year. In fact, up until the past two weeks claims data has been mostly bucking seasonal norms as they have continued to grind lower. But this week’s 10.46% increase is actually just about inline with the WoW increase that has been historically observed for the same week of the year (47th week) of 10.68%. In other words, the impact of rising COVID cases may have played a role, but seasonality is certainly another factor.
Taking a look at both regular state claims and Pandemic Unemployment Assistance (PUA) claims supports the impact of seasonality. While total claims rose to 1.139 million, the most since October 9th, the bulk of the increase came from regular state claims. PUA claims were actually lower this week, falling down to 311.7K from 319.7K. That is the third-lowest reading of the pandemic, only behind two weeks ago (296.4K) and the first week they were recorded back in April (218.8K).

As for continuing claims which are lagged an additional week to initial jobless claims, despite last week’s uptick in initial claims, there was a net outflow from the unemployment insurance system. Continuing claims fell for a ninth week in a row with this week’s reading of 6.071 million- the lowest reading since March 20th. That is also the second week in a row that claims have come in below the pre-pandemic record of 6.635 million from around the time of the Great Recession.

While regular state claims have improved, taking all programs into account the picture is a bit less rosy. The addition of other programs lags the data yet another week meaning the most recent data is for the week of November 6th. As of then, total continuing claims across all programs rose slightly from 20.494 million to 20.363 million. While higher, that is still below where total claims were two weeks prior. Additionally, the uptick that week mostly came from PUA and PEUC claims as every other program saw declines. With regards to the latter of the two, as we have frequently mentioned in recent weeks, PEUC claims’ share of total claims has continued to rise alongside claims from the Extended Benefits program. That means a growing share of existing continuing claims are extensions. Click here to view Bespoke’s premium membership options for our best research available.

Bespoke’s Morning Lineup – 11/25/20 – Thankful For…
See what’s driving market performance around the world in today’s Morning Lineup. Bespoke’s Morning Lineup is the best way to start your trading day. Read it now by starting a two-week free trial to Bespoke Premium. CLICK HERE to learn more and start your free trial.
“I am grateful for what I am and have. My thanksgiving is perpetual.” – Henry David Thoreau
The market isn’t in much of a good or bad mood this morning as futures are indicated modestly lower. The earnings news we did get overnight was generally positive, and there’s an avalanche of economic data jammed into today ahead of what will be a long holiday weekend for many.
This Thanksgiving isn’t going to be a typical one for most people, but there’s still a lot to be thankful for, so we hope you have a good day regardless. Happy Thanksgiving!
Be sure to check out today’s Morning Lineup for updates on the latest market news and events, economic data out of Asia, an update on the latest national and international COVID trends, and much more.

The holiday season is generally considered a great time of year for equities, but very short-term returns for the market based on seasonality haven’t been particularly strong. As shown in the snapshot from our Seasonality Tool, the S&P 500’s median historical return over the last ten years in the upcoming one-week period has been a gain of 0.24% which is right in the middle of the road compared to all other one-week periods throughout the year. One month later, median returns improve considerably to 1.99% which ranks in the 75th percentile relative to prior periods. Three month returns, however, have been very strong. The S&P 500’s median return of 6.30% in the three month period from today’s close ranks in the 98th percentile of all three-month periods throughout the year.

Daily Sector Snapshot — 11/24/20
Biden – Best Since Reagan
The market started off November on a positive note, and even after the election has continued to add to its gains. Through the close today (11/24), the S&P 500 is up 7.90% since the close on Election Day. Relative to every other Presidential election since the beginning of the S&P back in 1928, the three-week performance of the S&P 500 following this Election Day ranks as the second-best of all time. It came down right to the wire, but the only other US President to see a stronger market reaction to their election (or re-election) was Ronald Reagan in 1980 (7.97%). Behind Reagan and Biden, the only other Presidents where the S&P 500 experienced an upside move of 5%+ in reaction to their elections were Hoover in 1928 and Clinton in 1996.
On the downside, the most negative reaction of the market in the three weeks after Election Day was the 14.75% decline following President Obama’s election in 2008. In addition to Obama, the S&P 500’s four other three-week downside moves of more than 5% came after the elections of Truman in 1948, the election of George W Bush in 2000 (although at the time it was unknown who was the winner of that election), the election of Franklin D Roosevelt in 1932, and Dwight D Eisenhower’s re-election in 1956.
In aggregate, the S&P 500 hasn’t historically responded all that great in the three weeks after a Presidential election. For every one since 1928, the median return of the S&P 500 in the three weeks after Election Day has been a gain of just 0.35%. Breaking out returns by party, in the three weeks after a Democratic candidate is elected, the S&P 500’s median performance is a decline of 1.11% compared to a median gain of 3.04% when a Republican is elected. Click here to see Bespoke’s premium membership options and start a free trial for instant access to our research and interactive tools.

DJIA 1,000 Point Thresholds
What a wild year 2020 has been! With the DJIA closing above 30,000 today, it was the second first-time upside break of a 1,000 point threshold this year. While there have only been two new upside crosses of 1,000 point thresholds, due to the sharp pullback in March from the pandemic that briefly took the DJIA below 19,000 on a closing basis, there have actually been 12 different upside 1,000 point thresholds at some point in the year.
The table below lists the first time that the DJIA closed above each 1,000 point threshold in its history along with the total number of times the index has crossed that level on a closing basis throughout history. The thousand point level that has seen the most crosses on a closing basis was 11,000 (87 crosses) while 10,000 ranks second at 67.
Obviously, the higher the DJIA goes, the less impactful a move of 1,000 points becomes. At current levels, 1,000 points represents just 3.3%, which is really nothing more than a very bad day in the market. Given the diminishing impact of 1,000 points in the DJIA these days, their significance declines. Even still, the twelve new 1,000-point crosses since the 2016 election has given the President (who has publicly discussed the stock market more than any other President in history) plenty of ammunition to tweet about. Click here to see Bespoke’s premium membership options and start a free trial for instant access to our research and interactive tools.

Bespoke Stock Scores — 11/24/20
Richmond Manufacturing Taking a Rest
After a record high of 29 last month, the Richmond Fed’s monthly reading on the manufacturing sector was expected to decline. Rather than the drop to 20 that was forecasted, this month’s decline left the index even lower at 15. The 14-point month-over-month decline is the largest since the spring and tied January of 1999 and April of 2004 for the sixth-largest monthly decline in the index’s history. Considering that historically large decline is coming off the record high, though, the November reading is still consistent with further improvements in the district’s manufacturing sector just at a decelerated rate from October.

Given the large decline in the headline index experienced, breadth in this month’s report was notably weak. Across the 17 different sub-indices, all but four turned lower this month. As shown in the table below, similar to the composite reading, some of those declines were in the bottom 5% of all month over month changes on record for those respective indices. Granted, for several indices, those large declines come from historically elevated levels. As for those indices that managed to avoid a decline, Service Expenditures went unchanged, Raw Material Inventory declines decelerated, and prices paid and received both rose. Again though, the bulk of these readings were still indicative of expansionary activity but at a slower rate than the prior month.

While current conditions broadly showed deceleration, expectations were more optimistic. There were still a handful of indices for future expectations that declined this month—with those for Finished Good Inventories, Wages, and Availability of Skills the most significant decliners—but generally speaking outlook has continued to improve.

While still consistent with gains in new orders, the growth rate moderated significantly in November as the index dropped 20 points from a near-record high of 32 down to 12. Whereas the decline in November resulted in most other indices staying at the high end of their historical ranges, new orders is less elevated from a historical perspective only in the 73rd percentile. Similarly, the backlog of orders continues to grow but at a slower rate. Granted, the deceleration of order backlogs was much smaller than new orders in November as the index only dropped 3 points down to 11 which is still in the upper decile of all readings.

Given orders are still growing, inventories continue to be drawn upon at a rapid rate. In terms of raw material inventories, this month saw a contraction for just a fourth time in the history of the survey. Three of those contractionary readings have come from the past three months with last month’s reading a record low. Finished good inventories on the other hand are being drawn upon at a more rapid rate. That index fell 5 points this month to a record low of -7.

Other than the indices for inventories, those covering expenditures are the other indices that remain at historically low levels. This month saw sizable declines for Capital Expenditures and Equipment and Software Expenditures with the reading of the former consistent with more firms reducing spending rather than increasing. In other words, broadly speaking companies are not increasing spending on capital like they were a few months ago.

While that side of the production function has weakened, employment metrics are a bit healthier. As with the rest of the survey this month, these readings were consistent with decelerations, but overall manufacturing firms continue to increase hiring, wages, and workweek while they also report a lack of workers with in-demand skills.

Not only are wages rising but so too are Prices Paid and Prices Received with the former outpacing the latter. Click here to view Bespoke’s premium membership options for our best research available.
