Keeping Tabs On High Frequency Growth
The week ended September 11th showed a sharp decline in our index of weekly GDP versus the year before. As shown, our index can be quite volatile, but it does do a decent job tracking the general trajectory of GDP. Since peaking at an implied growth rate of +0.9% YoY on July 10th, our index has slid to -2% YoY, the lowest reading since mid-June.

Taking a look at another tracker of short-term economic growth, below we show Weekly Economic Index data updated by the New York Fed each week. After decelerating sequentially YoY for the week ended September 4th, the WEI reported sequential YoY growth slower once again in the week ended September 11th. We also show what each high frequency tracker implies about quarterly growth. As shown, our tracker has consistently implied a higher quarterly growth rate than the Weekly Economic Index, and official data for the last two quarters. That said, Q3 is tracking at least 20%, with upside to the high-20s as the US continues to rebound from COVID. This post was originally published in our post-market macro report — The Closer — last night. Click here to start a free trial to Bespoke Institutional and receive our nightly Closer for the next two weeks, featuring more commentary and data on macro markets.

Bespoke’s Morning Lineup – 9/18/20 – Down But Not Out
See what’s driving market performance around the world in today’s Morning Lineup. Bespoke’s Morning Lineup is the best way to start your trading day. Read it now by starting a two-week free trial to Bespoke Premium. CLICK HERE to learn more and start your free trial.
“We are drowning in information but starved for knowledge.” – John Naisbitt
After two days of declines, US futures are trying their best to close off the week on a positive note and break a two-week streak of multi-percentage point declines for the major indices. Even a modest loss today would still put equities in the black for the week, but it’s never fun to head into the weekend on a down note.
The economic calendar is relatively light today with Leading Indicators and Michigan Sentiment both coming out at 10 AM. We’ll also hear from Fed Presidents Bullard and Bostic before noon.
Be sure to check out today’s Morning Lineup for a rundown of the latest stock-specific news of note, market performance in the US and Europe, trends related to the COVID-19 outbreak, and much more.

After eleven straight months where large-cap growth stocks have outperformed, value stocks have held up considerably well this month. While the Russell 1000 Growth index is down over 7% MTD through Thursday, the Value index is holding up much better with a decline of less than one percent. The performance cap of 6.6 percentage points for Value relative to Growth is currently wider than any other month since March 2001! Needless to say, unless things change drastically between now and month-end, Value will finally break its streak of underperformance.

Weekly Sector Snapshot w/ Commentary
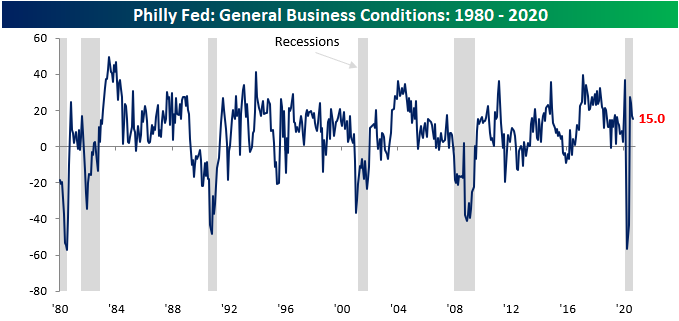
Philly Fed Flat
Unlike its neighbor to the north, the Philadelphia Fed Manufacturing Report lost a bit of steam in September. Economists were expecting the headline index of General Business conditions to remain unchanged at 17.5, but the actual level showed a modest decline to 15.0. Nothing to get alarmed about, but still weaker than expected. Even at current levels, though, it’s worth pointing out that September’s reading was still above the predominant levels we were seeing in the year leading up to the COVID outbreak.
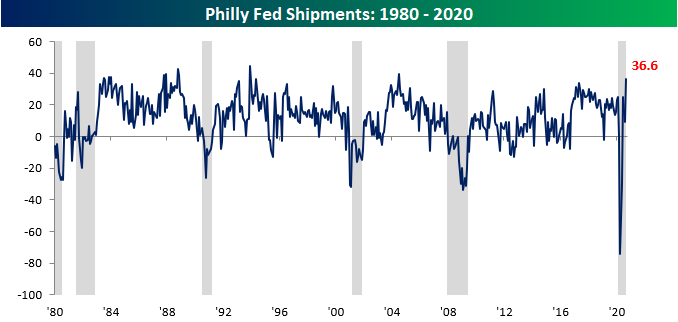
Breadth in this month’s report was also positive. Besides the index of General Business Conditions, the only other indices that declined on a m/m basis were Inventories and Average Workweek. On the upside, the biggest gains were seen in Shipments and Prices Paid. In the case of Shipments, its current level now ranks in the 98th percentile of all prior readings while Delivery Times are also elevated in the 96th percentile of all other periods.

This month’s surge in shipments also ranks as the highest level in over 16 years (July 2004), and that comes just six months after the lowest reading on record.
Finally, in the report’s special questions this month, respondents were asked how Q3 production will compare to Q2, and the responses were positive. 22.2% of those surveyed expect production to increase by more than 10% while just 11.1% expect business to contract by more than 10%. While these results bode well for Q3, the outlook for Q4 doesn’t look as great. Only 6.7% of respondents expect Q4 production to increase significantly while 11.1% expect activity to decline by a ‘significant’ margin. In a trend that doesn’t bode well for the current high levels of unemployment, of those expecting activity to increase, only 17% plan to accomplish this by hiring additional staff. The rest plan to either increase productivity, the hours of current staff, or other measures. Click here to start a free trial to Bespoke to unlock full access to all of our research and interactive tools.
Bullish Sentiment Bounces
With the S&P 500 rallying in the first two days of the week and early on Wednesday, bullish sentiment on the part of individual investors saw a sizable uptick over the last week. According to the latest weekly survey from the American Association of Individual Investors (AAII), bullish sentiment increased from 23.71% last week to 32.02%. That 8.31 percentage point increase was tied for the largest weekly increase since January 16th but only marks a three-week high in optimism.

With the big move into the bullish camp, there was an exodus of equal magnitude from the bears as negative sentiment fell from 48.45% down to 40.39%. The last time bearish sentiment dropped that much in a week was on February 13th just before the Q1 stock market peak. Similar to bullish sentiment but in the opposite direction, though, bearish sentiment was actually lower four weeks ago.

Even after the shifts in sentiment this week, though, the bull-bear spread remains negative at 8.34 percentage points.
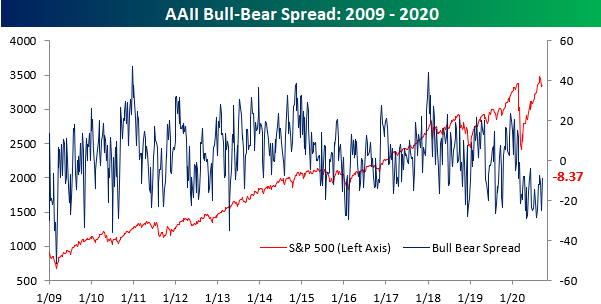
This week’s bull-bear spread now takes the current record streak of negative sentiment readings to 30 which is eight weeks longer than the prior record reading of 22 weeks back in late 1990. It’s been well-documented that the sample of this survey tends to skew bearish, but 30 weeks is a long streak! Click here to start a free trial to Bespoke to unlock full access to all of our research and interactive tools.

Chart of the Day: Rent-A-Center (RCII)
The Bespoke 50 Top Growth Stocks — 9/17/20
Every Thursday, Bespoke publishes its “Bespoke 50” list of top growth stocks in the Russell 3,000. Our “Bespoke 50” portfolio is made up of the 50 stocks that fit a proprietary growth screen that we created a number of years ago. Since inception in early 2012, the “Bespoke 50” has beaten the S&P 500 by 151.5 percentage points, which hit a new high this week. Through today, the “Bespoke 50” is up 297.5% since inception versus the S&P 500’s gain of 146.0%. Always remember, though, that past performance is no guarantee of future returns. To view our “Bespoke 50” list of top growth stocks, please start a two-week free trial to either Bespoke Premium or Bespoke Institutional.

Bespoke’s Morning Lineup – 9/17/20 – Up or Down?
See what’s driving market performance around the world in today’s Morning Lineup. Bespoke’s Morning Lineup is the best way to start your trading day. Read it now by starting a two-week free trial to Bespoke Premium. CLICK HERE to learn more and start your free trial.
“The person who turns over the most rocks wins the game.” – Peter Lynch
Futures are picking up right where they left off yesterday with downside momentum, although they’re modestly up from their overnight lows. It’s been a busy day for economic data already with Jobless Claims and the Philly Fed coming in roughly in line with consensus forecasts, Continuing Claims better than expected, but Housing Starts and Building Permits both weaker than expected.
Be sure to check out today’s Morning Lineup for a rundown of the latest stock-specific news of note, market performance in the US and Europe, updates on Asian and European economic data, trends related to the COVID-19 outbreak, and much more.
Was yesterday an up or down day for the US equity market? With the S&P 500 finishing the day down 0.46% and the Nasdaq down over 1%, it was obviously lower, but the internals of the market were actually positive. The S&P 500’s A/D line was +128 which was actually an improvement from the prior day where the S&P 500 was actually up over 0.5%. Additionally, the S&P 500 equal-weighted index also finished the day higher by more than 0.6%. In fact, as the chart below from page two of our Morning Lineup illustrates, even though the S&P 500 was down moderately on the day, the percentage of overbought stocks actually increased while the percentage of oversold stocks declined.
