Big Tech Earnings Upcoming
Seven of the eight big “mega-cap” Tech or Tech-related companies are set to report Q3 earnings before the end of October. Our Custom Portfolios tool available to Bespoke Premium and Bespoke Institutional members allows investors to easily monitor the upcoming earnings report dates for the stocks they care about most. Below is a snapshot of the upcoming earnings report dates for stocks in a “Big Tech” custom portfolio that we’ve built. (If you’re already a subscriber, you can import this portfolio into your Custom Portfolios by clicking here.)
Netflix (NFLX) is set to be the first of the mega-caps to report next Tuesday (10/20) after the close. As shown in our earnings calendar, analysts are looking for NFLX to earn $2.14/share this quarter with sales of $6.405 billion. In Netflix’s history as a public company, it has reported quarterly earnings 73 times and exceeded EPS estimates 84% of the time. NFLX has beaten sales estimates 62% of the time and raised forward guidance 25% of the time. In terms of NFLX’s share-price reaction to earnings, the stock has historically averaged a one-day gain of 0.35% on its earnings reaction day (the first full trading day following its earnings release). NFLX is the most volatile of the mega-cap stocks on the list when it comes to earnings with an average absolute one-day change of 12.29% on earnings reaction days.
Tesla (TSLA) reports next Wednesday (10/21) after the close and expects to earn $0.60/share on $8.3 billion in revenues. TSLA has one of the lowest EPS beat rates of the group, but it has averaged a one-day gain of 1.86% on its prior 40 quarterly earnings reaction days.
Next up after Tesla is Amazon (AMZN), which reports next Thursday (10/22) after the close. Amazon is expected to report quarterly sales of $91.6 billion, which would be $23 billion more than the $68 billion in sales it did in Q3 2019. While Q4 is normally AMZN’s best quarter due to the holiday shopping period, if AMZN meets Q3 sales expectations, it would be $5.5 billion more in sales than the company did last Q4.
The following week we’ll get reports from Microsoft (MSFT) on Tuesday (10/27) after the close and then Apple (AAPL), Facebook (FB), and Alphabet (GOOG) on Thursday (10/29) after the close. Of these names, Facebook (FB) has historically beaten EPS and sales estimates at the highest rate (91%), and it’s also the stock that has historically reacted the most positively on its earnings reaction days. To build your own custom earnings calendar of the stocks you care about most, start a two-week free trial to Bespoke Premium today.

Along with getting a helpful earnings calendar for stocks in the Custom Portfolios that you can build, you can also see your stocks run through our Trend Analyzer and Chart Scanner tools. Our Trend Analyzer tool lets you quickly and easily see where stocks or ETFs in your portfolio are trading relative to their historical trading ranges. As shown below, the eight mega-cap stocks in our “Big Tech” portfolio have all moved back above their 50-day moving averages as of this morning and half of them (AMZN, MSFT, NFLX, NVDA) are trading in overbought territory. Of the overbought names, Netflix (NFLX) is the most extended into “extreme” territory. You can learn more about our Trend Analyzer and how to get the best use out of it when you start a two-week free trial to Bespoke Premium.

Finally, our Chart Scanner tool lets you quickly browse through the chart patterns of all the stocks in your Custom Portfolios so you can stay on top of technicals. By checking up on the charts each day, you’ll be able to more easily spot technical breakouts or breakdowns for stocks in your portfolio and potentially act on them if needed. Below is a snapshot of the price charts for the eight “Big Tech” stocks as it would be viewed by members on our website. To build or import your own Custom Portfolio today, start a two-week free trial to Bespoke Premium. It’s worth a try!

Chart of the Day – 52-Week High “Farm Team”
Year-to-Date Sector ETF Performance
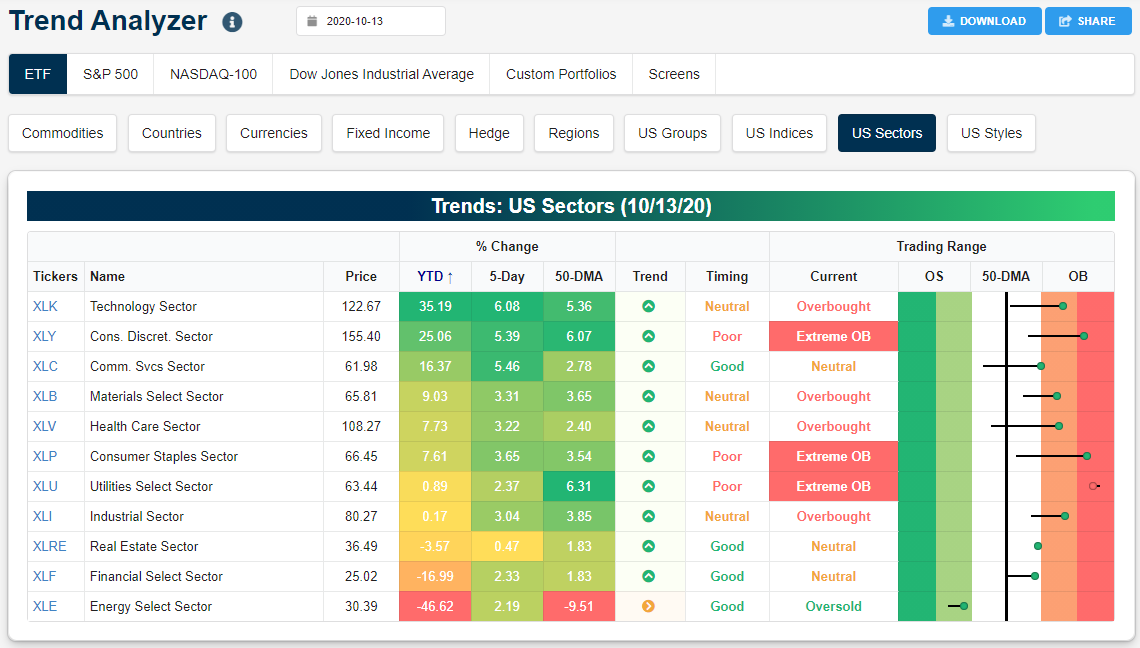
The most popular S&P 500 ETF — SPY — is currently up 10% year-to-date. Below is a snapshot from our Trend Analyzer tool (available to Bespoke Premium subscribers) that shows S&P 500 sector ETFs and their year-to-date performance (among other stats). As shown, eight of the eleven major sector ETFs are in the green for the year, with Technology (XLK) leading the way at +35.2%. That’s a pretty incredible move in a pandemic year, and it shows just how powerful the Tech sector is regardless of how well the “physical” economy is doing. The Consumer Discretionary sector (XLY) ranks second with a year-to-date gain of 25.06%, but that gain is mostly buoyed by Amazon.com (AMZN), which is easily the largest stock in the cap-weighted sector. The only other sector that’s up more than 10% on the year is Communication Services (XLC) at +16.4%.
Materials (XLB), Health Care (XLV), Consumer Staples (XLP), Utilities (XLU) and Industrials (XLI) are the remaining sectors in the green in 2020 with gains between 0 and 10%. On the downside, Real Estate (XLRE) is only marginally in the red with a YTD decline of 3.57%, and then you get to the two big losers on the year — Energy (XLE) and Financials (XLF). The Financial sector (XLF) is down 17% so far this year while Energy (XLE) is down 46.6%. The gap of more than 80 percentage points between the year’s best and worst performing sectors is something that rarely happens, but then again, 2020 has been a year like no other! Try our Trend Analyzer tool with a two-week free trial to Bespoke Premium.
Bespoke’s Morning Lineup – 10/14/20 – Positive Earnings, Negative Reactions
See what’s driving market performance around the world in today’s Morning Lineup. Bespoke’s Morning Lineup is the best way to start your trading day. Read it now by starting a two-week free trial to Bespoke Premium. CLICK HERE to learn more and start your free trial.
“A few solid pros are more powerful than dozens of cons,” – Steve Jobs
Bulls are looking to get back on track this morning following Tuesday’s weakness. Futures are trading modestly higher in the pre-market and have been building on those gains as we approach the open. In economic news, PPI came in hotter than expected on both a headline and core basis, rising 0.4% m/m versus expectations for growth of just 0.2%.
Be sure to check out today’s Morning Lineup for a rundown of the latest stock-specific news of note, market performance in the US and Europe, industrial production in Europe, trends related to the COVID-19 outbreak, and much more.

It’s been a positive morning for earnings reports this morning. Of the eight companies reporting so far, the only one to miss EPS forecasts was Wells Fargo (WFC), while the only one to report weaker than expected sales was Bank of America (BAC). On the upside, Goldman (GS), PNC, and UnitedHealth (UNH) all had the biggest EPS beats while Goldman also saw a healthy beat on the revenue front as well.

All these strong results should set the market up for some strong performance this morning, right? Well, not necessarily. Yesterday we saw a similar story with a number of solid reports from S&P 500 companies, but when the stocks opened for trading, all but one traded lower for a median decline of over 2%. Hopefully, for the broader market, this doesn’t become a trend, but we’ll be watching it in real-time.

Daily Sector Snapshot — 10/13/20
B.I.G. Tips – Death by Amazon – 10/13/20
Amazon is now up over 1700% since inception of our Death By Amazon indices, while our equally-weighted Death By Amazon index has lagged the S&P 1500 by 70 percentage points over that period. Amazon hasn’t managed to push back above its July 9th relative performance when it rose to 5.83% of the S&P 500’s market cap. Earnings are due in 10 days, with analysts expecting EPS to rise over 70% versus a year ago on revenues 31.7% higher. Contrary to popular perception, Amazon is very profitable. For Q3, analysts forecast a 14.6% EBITDA margin versus 13.8% a year ago, meaning the company earns 17 cents of EBITDA for each dollar of new revenue. Of course, much of that comes from cloud, where competitive pressures are intensifying, but cash flow is cash flow at the end of the day. As for competitors, the fact that we’ve removed another name from our index this month (SMRT due to bankruptcy) is just more evidence of the force of Amazon at work.
Our “Death By Amazon” index was created many years ago to provide investors with a list of retailers we view as vulnerable to competition from e-commerce. In 2016, we also created our “Amazon Survivors” index which is made up of companies that look more capable of dealing with the threat from online shopping. To see how the two indices have been performing lately and view the full list of stocks that make up the indices, please read our newest report on the subject available to Bespoke Premium and Bespoke Institutional members.
To unlock our “Death By Amazon” and “Amazon Survivors” indices, login or start a two-week free trial to either Bespoke Premium or Bespoke Institutional.

Small Businesses Cautiously Optimistic
In an earlier post, we highlighted the details of the September NFIB Small Business Optimism report. The report showed overall sentiment among small businesses has continued to improve as demand has bounced back (though it has not yet fully recovered as still more businesses report lower sales and earnings on a net basis) leading to low inventory levels, higher prices, and a need for more employment. While generally improved conditions have lifted optimism, that is not to say small businesses have given an all-clear. The Uncertainty Index from NFIB has risen each of the past three months with September’s 2-point increase bringing it back to the same level as March of this year. In other words, it is perhaps best to say that small businesses are cautiously optimistic.

From the pandemic to the Election, there are plenty of reasons for businesses to be uncertain. As for what they are reporting to be the biggest problems, labor remains at the top. 30% of businesses have reported that either cost (9%) or more predominately quality (21%) of labor are their biggest issues. While off the highs from the past few years, the current readings are still historically elevated.
Behind labor, government related problems also are largely on the minds of business owners. Government red tape and taxes combine to account for 29% of businesses’ biggest problems. While that is a large share, neither of those indices are at any sort of extreme.
Poor sales, on the other hand, remains as the third major concern for businesses. 12% of businesses reported poor sales as the single most important issue in September, down from 15% in August and 7-percentage points lower than the April peak. While improved, the number of businesses seeing demand as a major issue is still at some of the highest levels of the past several years. Click here to view Bespoke’s premium membership options for our best research available.

Small Business Smiles
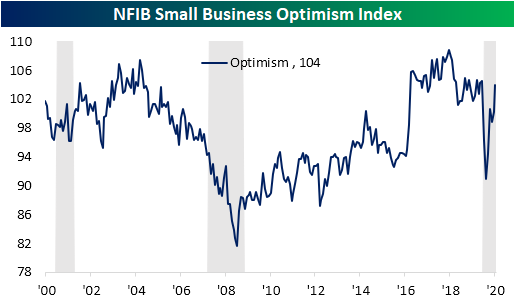
Sentiment among small businesses continued to improve in the month of September according to the NFIB’s monthly Small Business Optimism Index. As shown below, the index rose 3.8 points to 104 which is now just half of a point below the levels prior to the pandemic in February. That was also better than expectations of a smaller improvement to 101.2. Small business sentiment has now risen in four of the past five months.
In the table below, we break down this month’s report by each of the ten components of the headline number as well as the many other indices included in the report such as those not used as inputs to the headline number and what small businesses are reporting to be their biggest problems.
Across all indices of the September report, breadth was solid with only a couple of indices falling month over month—Expected Credit Conditions and Credit Conditions Availability. Some of those that were higher saw record or near-record month-over-month increases.
Some of the most notable indices this month included those regarding inventories. The Current Inventories index which gauges the net percent of owners viewing current inventory levels as too low rose 2 points to a record high reading of 5. Given this, the index for Plans to Increase Inventories is tied with the reading from November of 2004 for a record high of 11. Indicating low inventory levels, the report is consistent with some other recent data like the regional Fed manufacturing surveys. Those low inventories are resulting in higher prices as that index’s 12-point increase in September marked the biggest one month gain on record. While the Higher Prices index is not at any sort of an extreme, September’s move indicates that a rising number of businesses are raising prices.
Additionally, those higher prices and lower inventory numbers appear to be a result of demand that continues to rapidly improve. The indices for Actual Sales and Actual Earnings Changes remain negative for a sixth and tenth month in a row, respectively, meaning a net number of businesses continue to see lower rather than higher top and bottom-line numbers. But these indices are seeing big moves higher. For the index of Actual Earnings Changes, the 13-point climb in September was the largest on record and the 9-point increase for Actual Sales Changes followed a 13-point increase in August; both being some of the largest one-month moves on record. In order to meet the needs of this demand, a higher number of businesses plan to increase employment with that index rising to 28; the highest level since December of 2018. Even though businesses seek to hire more, they also report it is hard to fill positions as the index of Job Openings Hard to Fill rose to the top 5% of all readings. Cost and quality of labor also were reported as two of the most pressing problems for businesses. Click here to view Bespoke’s premium membership options for our best research available.


The Most Volatile Stocks on Earnings: Q3 2020
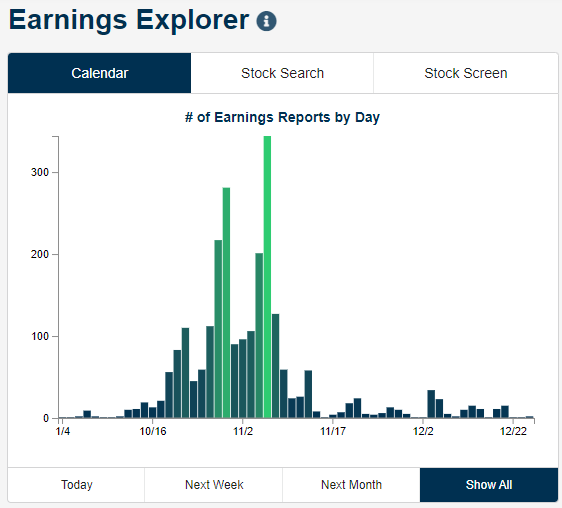
The Q3 earnings season began in earnest this morning with the first of the big banks (C and JPM) reporting. As shown below, the number of reports per day will get larger and larger over the next few weeks with the peak coming in the first week of November.
As we do at the start of each earnings season, below is our list of the most volatile stocks on earnings. These are stocks with at least ten years of quarterly earnings reports that have historically seen the biggest price moves on their earnings reaction days. (For a stock that reports after the close, its earnings reaction day is the next trading day’s change. For a stock that reports before the open, its earnings reaction day is that day’s change.)
As shown, Infinera (INFN) is the most volatile stock on earnings for those stocks with at least ten years of earnings reports. INFN has historically averaged a one-day change of +/-15% on its earnings reaction days. Stamps.com (STMP) ranks second with an average change of +/-13.5% on earnings, followed by Glu Mobile (GLUU) and Conn’s (CONN). Netflix (NFLX) ranks fifth on the list with an average one-day change of +/-12.29% on earnings. NFLX is by far the biggest stock on the list with sales estimates this quarter of $6.4 billion.
Other notables on the list of most volatile stocks include iRobot (IRBT), Overstock.com (OSTK), First Solar (FSLR), Align Tech (ALGN), and Booking Holdings (BKNG).
Most stocks on the list below don’t report earnings until later this month or in early November. Netflix (NFLX) and iRobot (IRBT) are the stocks on the list that will report first on October 20th.

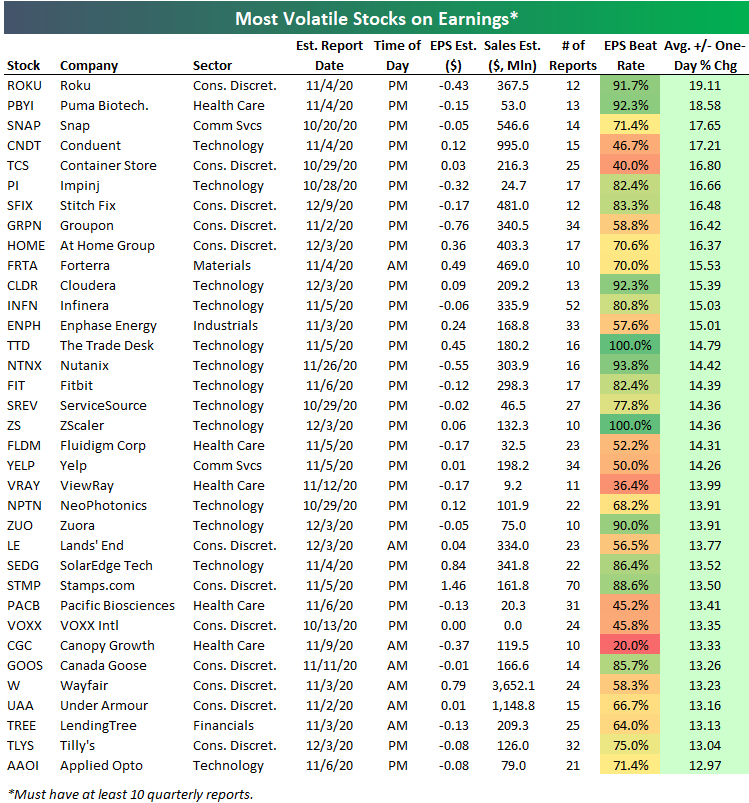
If we broaden our list to include stocks that only have at least 10 quarterly earnings reports, a lot of new names show up that haven’t been public for very long. At the top of the list below is Roku (ROKU) which has had 12 quarterly reports in its history. ROKU has historically averaged a one-day change of just under 20% (19.1%) on its earnings reaction day. It’s pretty incredible for a company to average a 20% swing in its market cap on one day every three months.
The first eleven stocks on the list below are not on the list above because they don’t have more than ten years worth of quarterly earnings data. These include names like Snap (SNAP), the Container Store (TCS), Stitch Fix (SFIX), Groupon (GRPN), and At Home Group (HOME). Other well-known stocks that normally see huge moves in reaction to earnings include Fitbit (FIT), Yelp (YELP), Canopy Growth (CGC), Canada Goose (GOOS), Wayfair (W), and Lending Tree (TREE). Try out our Earnings Explorer tool for free with a two-week trial to Bespoke Institutional.
B.I.G. Tips – Here Comes Earnings Season
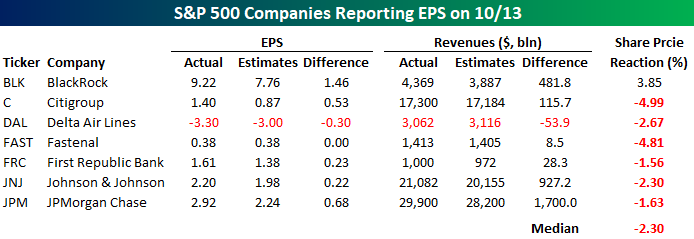
We’re thirteen days into the fourth quarter, but today was the first real day of earnings reports as a number of major banks and other firms in the S&P 500 reported Q3 earnings. As shown in the table below, of the seven S&P 500 companies that reported today, five topped EPS forecasts, and six out of seven reported better than expected revenues. The only disappointment relative to expectations was Delta (DAL) which missed both the top and bottom line. While the results have been positive relative to expectations, investors have mostly been selling the news. Of the seven companies that reported today, six are down on the day, and all of them are down at least 1.5%. All in all, the median performance of the seven stocks shown is a decline of 2.22%…not exactly a sign of upside surprise from the market.
What can we expect to see from the market as earnings season progresses? Make sure to check our quarterly preview of the upcoming earnings season for a look at how analyst sentiment tends to impact market performance during earnings season. For anyone with more than a passing interest in what to expect from the market during earnings season, make sure you check out this report. To see it, sign up for a monthly Bespoke Premium membership now!